Vector Map
To define a Vector Map that shows the life expectancy of the world population by countries we must write the following code:
1 2 3 4 5 6 7 8 9 10 11 12 13 14 15 16 17 18 19 20 21 22 23 24 25 26 | |
The previous code will render a Vector Map like the one below:
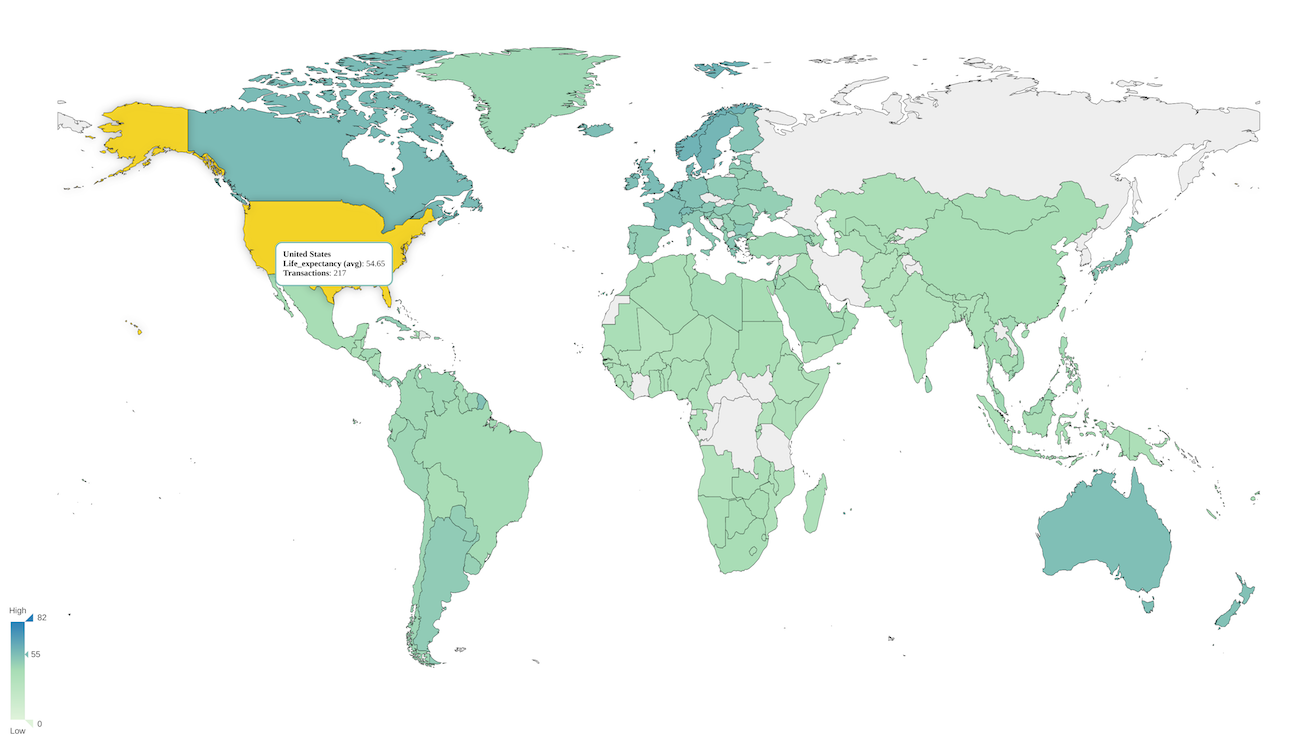
When using shape files, make sure data values match exactly with shape names. For example, if your dataset defines "United States" as "USA" and your shape file expects "United States", then you need to use a Derived Attribute to translate this value. Alternatively, you can update the dataset on your data engine.
Specifying shape information
Shapes can be specified in GeoJson format either with a resource URL or a GeoJSON object.
1 2 3 | |
Out of the box shape files
There are two shape files available out of the box:
- "world" - this is the world map with Country shapes. Refer to the World map shape names for supported shape names.
- "usa" - this is the United States map with State shapes. Refer to the United States shape names for supported shape names.
Make sure data values match exactly with shape names. Otherwise, the shapes will not be colored. If your data values don't match the out-of-the-box shape names, you have three options:
- Update your dataset on your data engine
- Provide your own shape file where names match your data values
- Use a Derived Attribute to translate data values to shape values. The sample code below creates the
cntry_matchedderived attribute to translate "USA" to "United States" as well as a few other country names that did not match the data values. Please refer to the Derived Attribute document for more details on how to create a derived attribute.
1 2 3 4 5 6 7 8 9 10 11 12 13 14 15 16 17 18 19 20 21 22 23 24 25 26 27 28 29 30 31 32 33 34 35 36 37 38 39 40 41 42 | |
Legend
We can position the legend in different ways. Available positions are:
- right
- left
- top-right
- top-left
- bottom-right
- bottom-left
For more information you can read the Legend section.
Custom Data
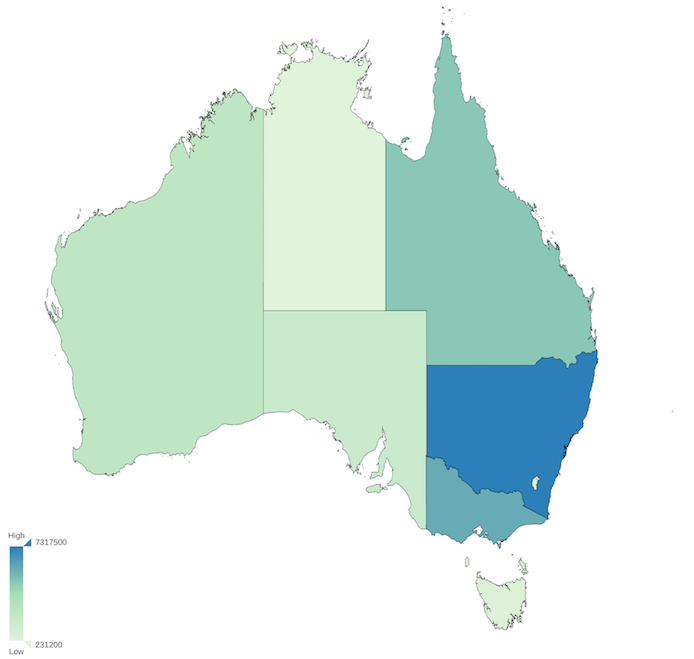
Vector Maps support custom data. The example below uses Custom Data to render the Australia map:
1 2 3 4 5 6 7 8 9 | |
To see the full code and running demo click here.
The previous code will render the following map:
Additional Options
center
Sets the initial center of the map. Example: .set('center', [0,0]). It is null by default which translates to the center of the shape.
enableZoom
Enables or disables the zoom and pan on the map. Example: .set('enableZoom', false). Zoom is enabled by default.
min
Defines the min value to use when creating the color scale from the color palette provided. It only applies when color ranges are not configured.
max
Defines the max value to use when creating the color scale from the color palette provided. It only applies when color ranges are not configured.
showNameOnHover
Sets if the map should display the region name when the mouse goes over the region Example: .set('showNameOnOver', true). It is false by default.
zoom
Sets the initial zoom value of the map. Example: .set('zoom', 0.5). It is 1 by default.
Listening to custom events
ChartFactor Toolkit Maps have special events to which you can subscribe to obtain current zoom information or the position where the map is located, here are some examples.
1 2 3 4 5 6 7 | |
As specified in the events documentation, you can also subscribe to click events in the Vector Map. The click event is dispatched as soon as users click on a specific layer, be it a marker, a proportional circle, a shape or any other type of layer. See the following example.
1 2 3 4 5 6 7 8 9 10 11 12 13 14 15 16 17 18 19 | |
The callback function receives the e object as a parameter with the following properties:
- name: the current event name
- chart: the current visualization id
- data: the current zoom value when the event is
mapzoom, the current map center when ismapmoveand an object with the layer internal information when it is aclickevent - nativeData: the whole leaflet native information correspondent to the specific type of layer