Range Filter
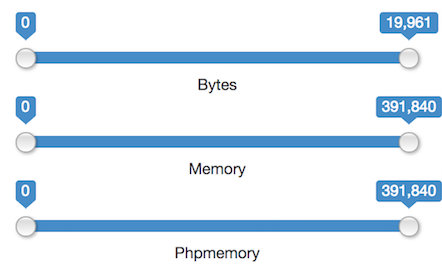
The Range Filter allows to display metrics as horizontal sliders and whenever they are moved, the Range Filter will trigger a filter with an operation of type "BETWEEN" with the slider's metric and the selected range. Each slider will have a start and stop value, that will be represented by the min() and max() aggregation functions done over that metric. So the first requisite for the Range Filter to work is that the source provider allows these two aggregations.
1 2 3 4 5 6 7 8 9 10 11 12 13 14 15 16 17 18 19 20 21 22 23 24 | |
This code will render the Range Filter:
Note
Metrics defined for range filters don't need min or max functions. The Range Filter automatically queries these two values. You can use any defined metric even when it has a function defined such as "sum". The Range Filter doesn't work with the special metric "Count". If included, it is ignored.