The Tooltip Object
The ChartFactor tooltip utility is an object of type Tooltip that can be accessed in the following way:
1 | |
Everytime the user hovers a visualization, this object will render the tooltip at the mouse position with the content (string or html string) passed as parameter. Additionally it can be used also in custom applications with other elements besides the built-in visualizations.
1 2 3 4 5 6 | |
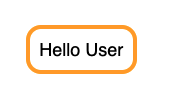
The code above sets the content and border color of the toolkit and finally invokes the .show() function to render the following:
Additional css can be passed as a third parameter to the set function:
1 2 3 4 5 6 7 | |

Finally to hide the tooltip we just need to call .hide():
1 | |
For example let's say we want to display a tooltip when hovering a react component:
1 2 3 4 5 6 7 8 9 10 11 12 13 14 15 16 | |