Welcome to ChartFactor
ChartFactor is a new approach to building data applications with both exploration and exploitation capabilities.
The approach can be described in 3 areas:
a) ChartFactor doesn't dictate the technology you run on. The deliverable is just a zip file that you can deploy with any web server technology flavor (e.g. apache web server, python http server, nginx, etc.). With this BYOWT (Bring Your Own Web Tech), it gives you the freedom of technology selection in terms of what to host and where to host it (completely cloud agnostic).
b) The architecture is really simple with web browser or device connecting to web server (hosting Chartfactor's javascript files) and potentially your data sources. This helps not only minimize failure points, but also optimize performance due to its streamlined architecture.
c) ChartFactor provides code transparency to allow advanced users to use its analytics language (based on existing sample code and documentation) to do complex calculations, visualization settings, etc. to get the most value and insights from their data.
In addition to these 3 areas of differentiation, the simplicity and the smooth user experience of the product allows users to quickly visualize data in minutes. This can be easily seen in the user-experience-first design of the product.
ChartFactor includes:
- Visual data interactivity and rapid development with ChartFactor Studio
- Powerful and flexible embedded analytics with ChartFactor Toolkit
- Instant application generation with Studio CLI
Let's explore these items in more detail.
ChartFactor Studio
ChartFactor Studio enables the discovery of insights through data interaction. It is similar to other visual analytics environments in that it allows users to easily visualize and interact with their data. The main difference is that it also allows users to see the code that powers its analytics functionality at all times, no matter if users are changing visualization settings, adding filters across visualizations and sources, drilling in or drilling through visuals. Studio acts as a container of ChartFactor components for transparent embedding of visual analytics functionality into your data applications. In ChartFactor Studio, everything is a component exposed as code.
ChartFactor Toolkit: The new way to do embedded analytics
ChartFactor Toolkit is a collection of components that speed up the implementation of data applications that are scalable and easy to use. It includes a large array of visualizations that are completely configurable. It also includes components for native connectivity to modern data engines, and interactivity components that enable drill-down, drill-through, slicing, range filtering, and advanced interactivity rules between components all in a declarative way.

Studio CLI
Studio CLI is designed to save you time when creating advanced data applications. It translates Studio dashboards into native web applications with code that is easy to understand and make it your own. Generated applications include all the visualizations and interactivity of the original Studio dashboard. No limit exists on how many sources can be used within an application. End-users are able to interact, filter, drill-in, and drill-thru across all sources.

Why users love ChartFactor
No BI servers required
ChartFactor is freshly built with the latest advances in software architecture and design to enable not only embedded BI but also serverless BI, removing the cost and complexity of integrating a traditional BI tool. ChartFactor's edge computing design means that your data application can scale to tens of thousands of users and petabytes of data, only limited by the scalability of your data engine.
Rich and completely configurable library of pre-packaged visualizations
Data visualizations, even simple bars, can be time consuming to implement when taking into account details such as labels, legends, tooltips, colors, axis display, between others. We also need to consider animation when users interact with their data. ChartFactor removes the work of programmatically binding the data to the chart and provides sensible defaults for many out-of-the-box visualizations to light up powerful visualizations in minutes. Simple things are fast and easy, yet everything is possible through complete configurability.
Data providers for modern data engines
It is common for modern data environments to include several data source technologies. For example, data for log analysis may reside in ElasticSearch while data obtained from business operations may reside in big data stores such as Google Big Query, Dremio, or behind a BI product. ChartFactor encapsulates interactions with these technologies behind data provider implementations to enable obtaining aggregate or raw data in a uniform fashion. The ChartFactor core components are separate from protocols, applications, and other packages, enabling data provider upgrades and feature additions with minimal retesting of the data application.

Consistent information in any location
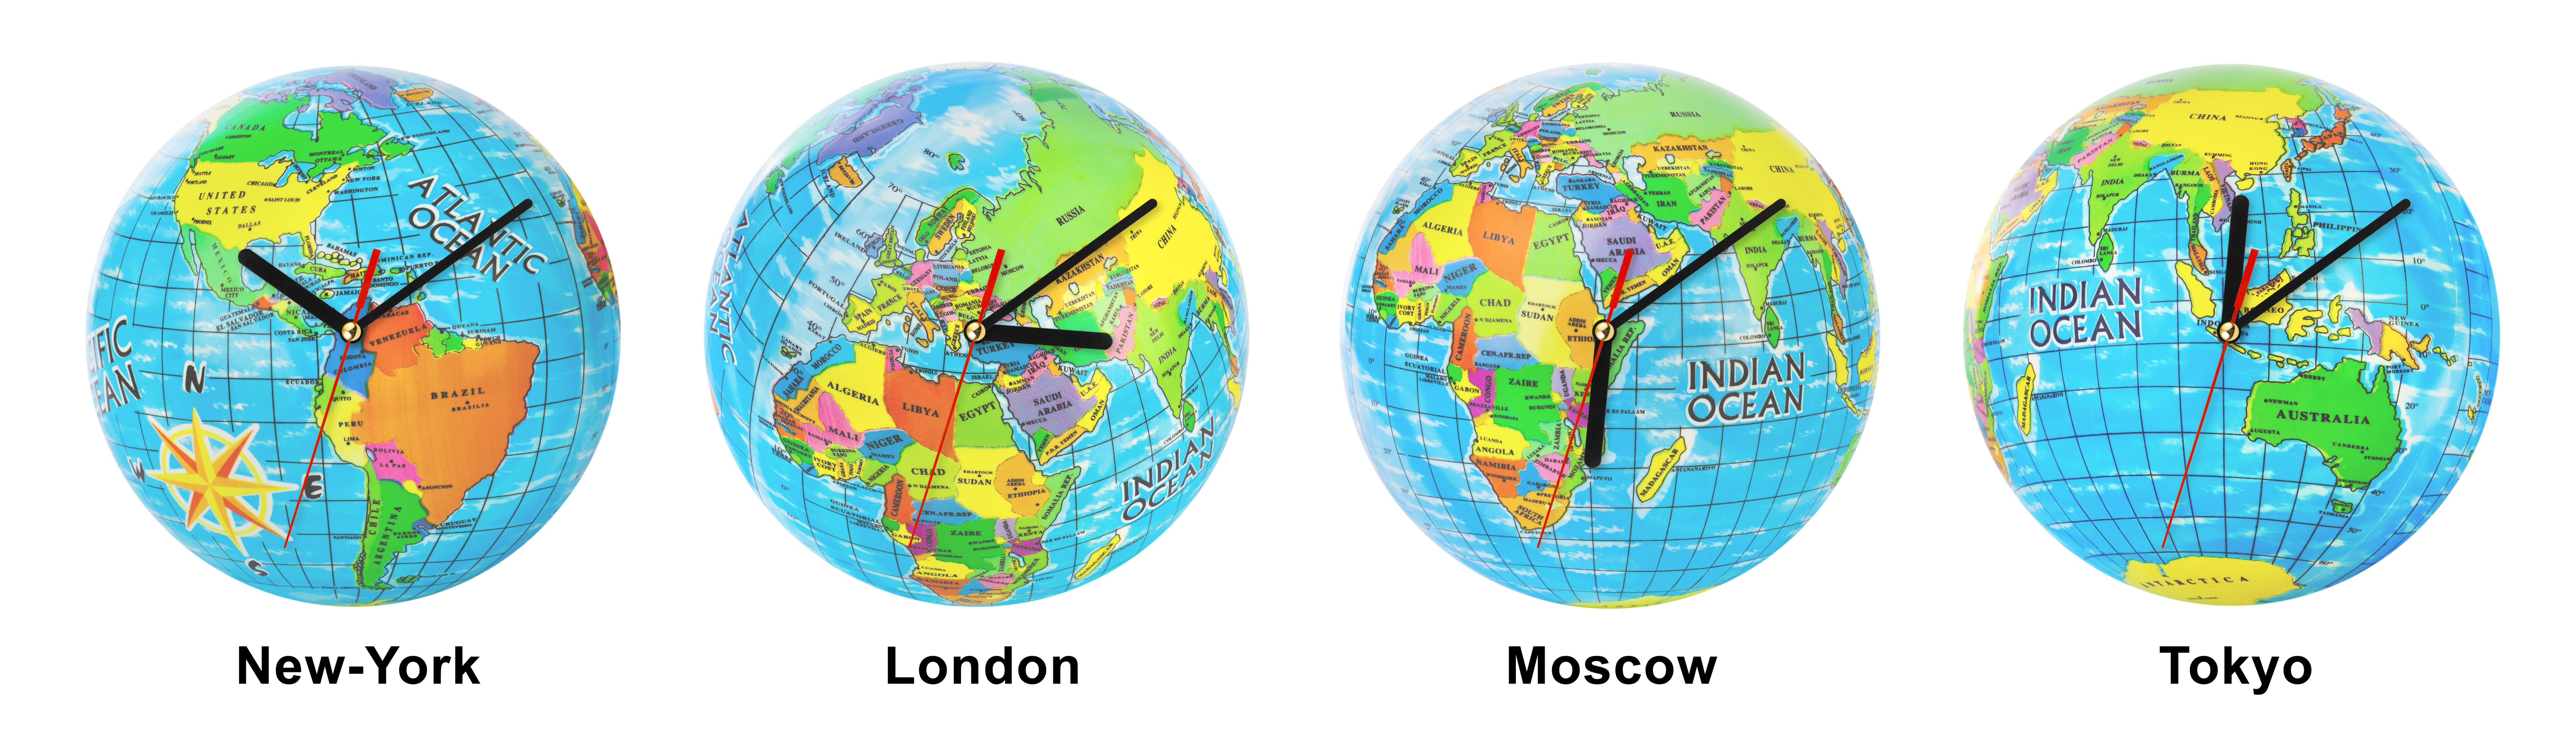
Businesses conduct transactions across different time zones. Chartfactor’s time zone support makes it easy to visualize consistent information about the time of events and transactions coming from streaming and historical sources.
Custom charts with no constraints
Visualization libraries are constantly evolving. ChartFactor enables developers to take advantage of their favorite visualization libraries without limitations. Leveraging its microservice architecture, ChartFactor custom charts become part of a system of visualizations that empowers end users to interact with them, adding filters, drill-ins, and having them react to those interactions in any custom way needed.

Streaming sources support
ChartFactor’s fresh innovative lightweight architecture allows you to visualize streaming data and replay historical data within Studio or straight from your web applications without long implementation cycles, crazy hardware requirements or cloud service charges.

Clear and concise programming model
ChartFactor provides a declarative model to specify data aggregations and how visualizations should be rendered. For example, on the data side, you can specify how data is grouped, sorted, limited, what metrics are aggregated, what operation is used in the aggregation. On the visualization side, you can specify the type of chart to render and all its visualization details. This declarations become a “program” that ChartFactor then executes in an efficient way. ChartFactor will query the data, wait for the data to be returned, and render visualizations according to the declarations provided.
Internally, ChartFactor uses a computational DAG (directed acyclic graph) that allows you to declare operations for later execution. It also includes an optimization component to optimize operations in the DAG before execution. The execution engine performs all operations defined in the DAG. It delegates to the declared data providers to translate the defined queries to technology-specific data query syntax and to the visualization providers to translate visualization instructions into technology-specific visualizations.
ChartFactor GPT assistant
The ChartFactor GPT assistant is a great resource to ask questions about ChartFactor! It has been trained with the contents of this documentation, ChartFactor Studio examples, and ChartFactor forum entries.
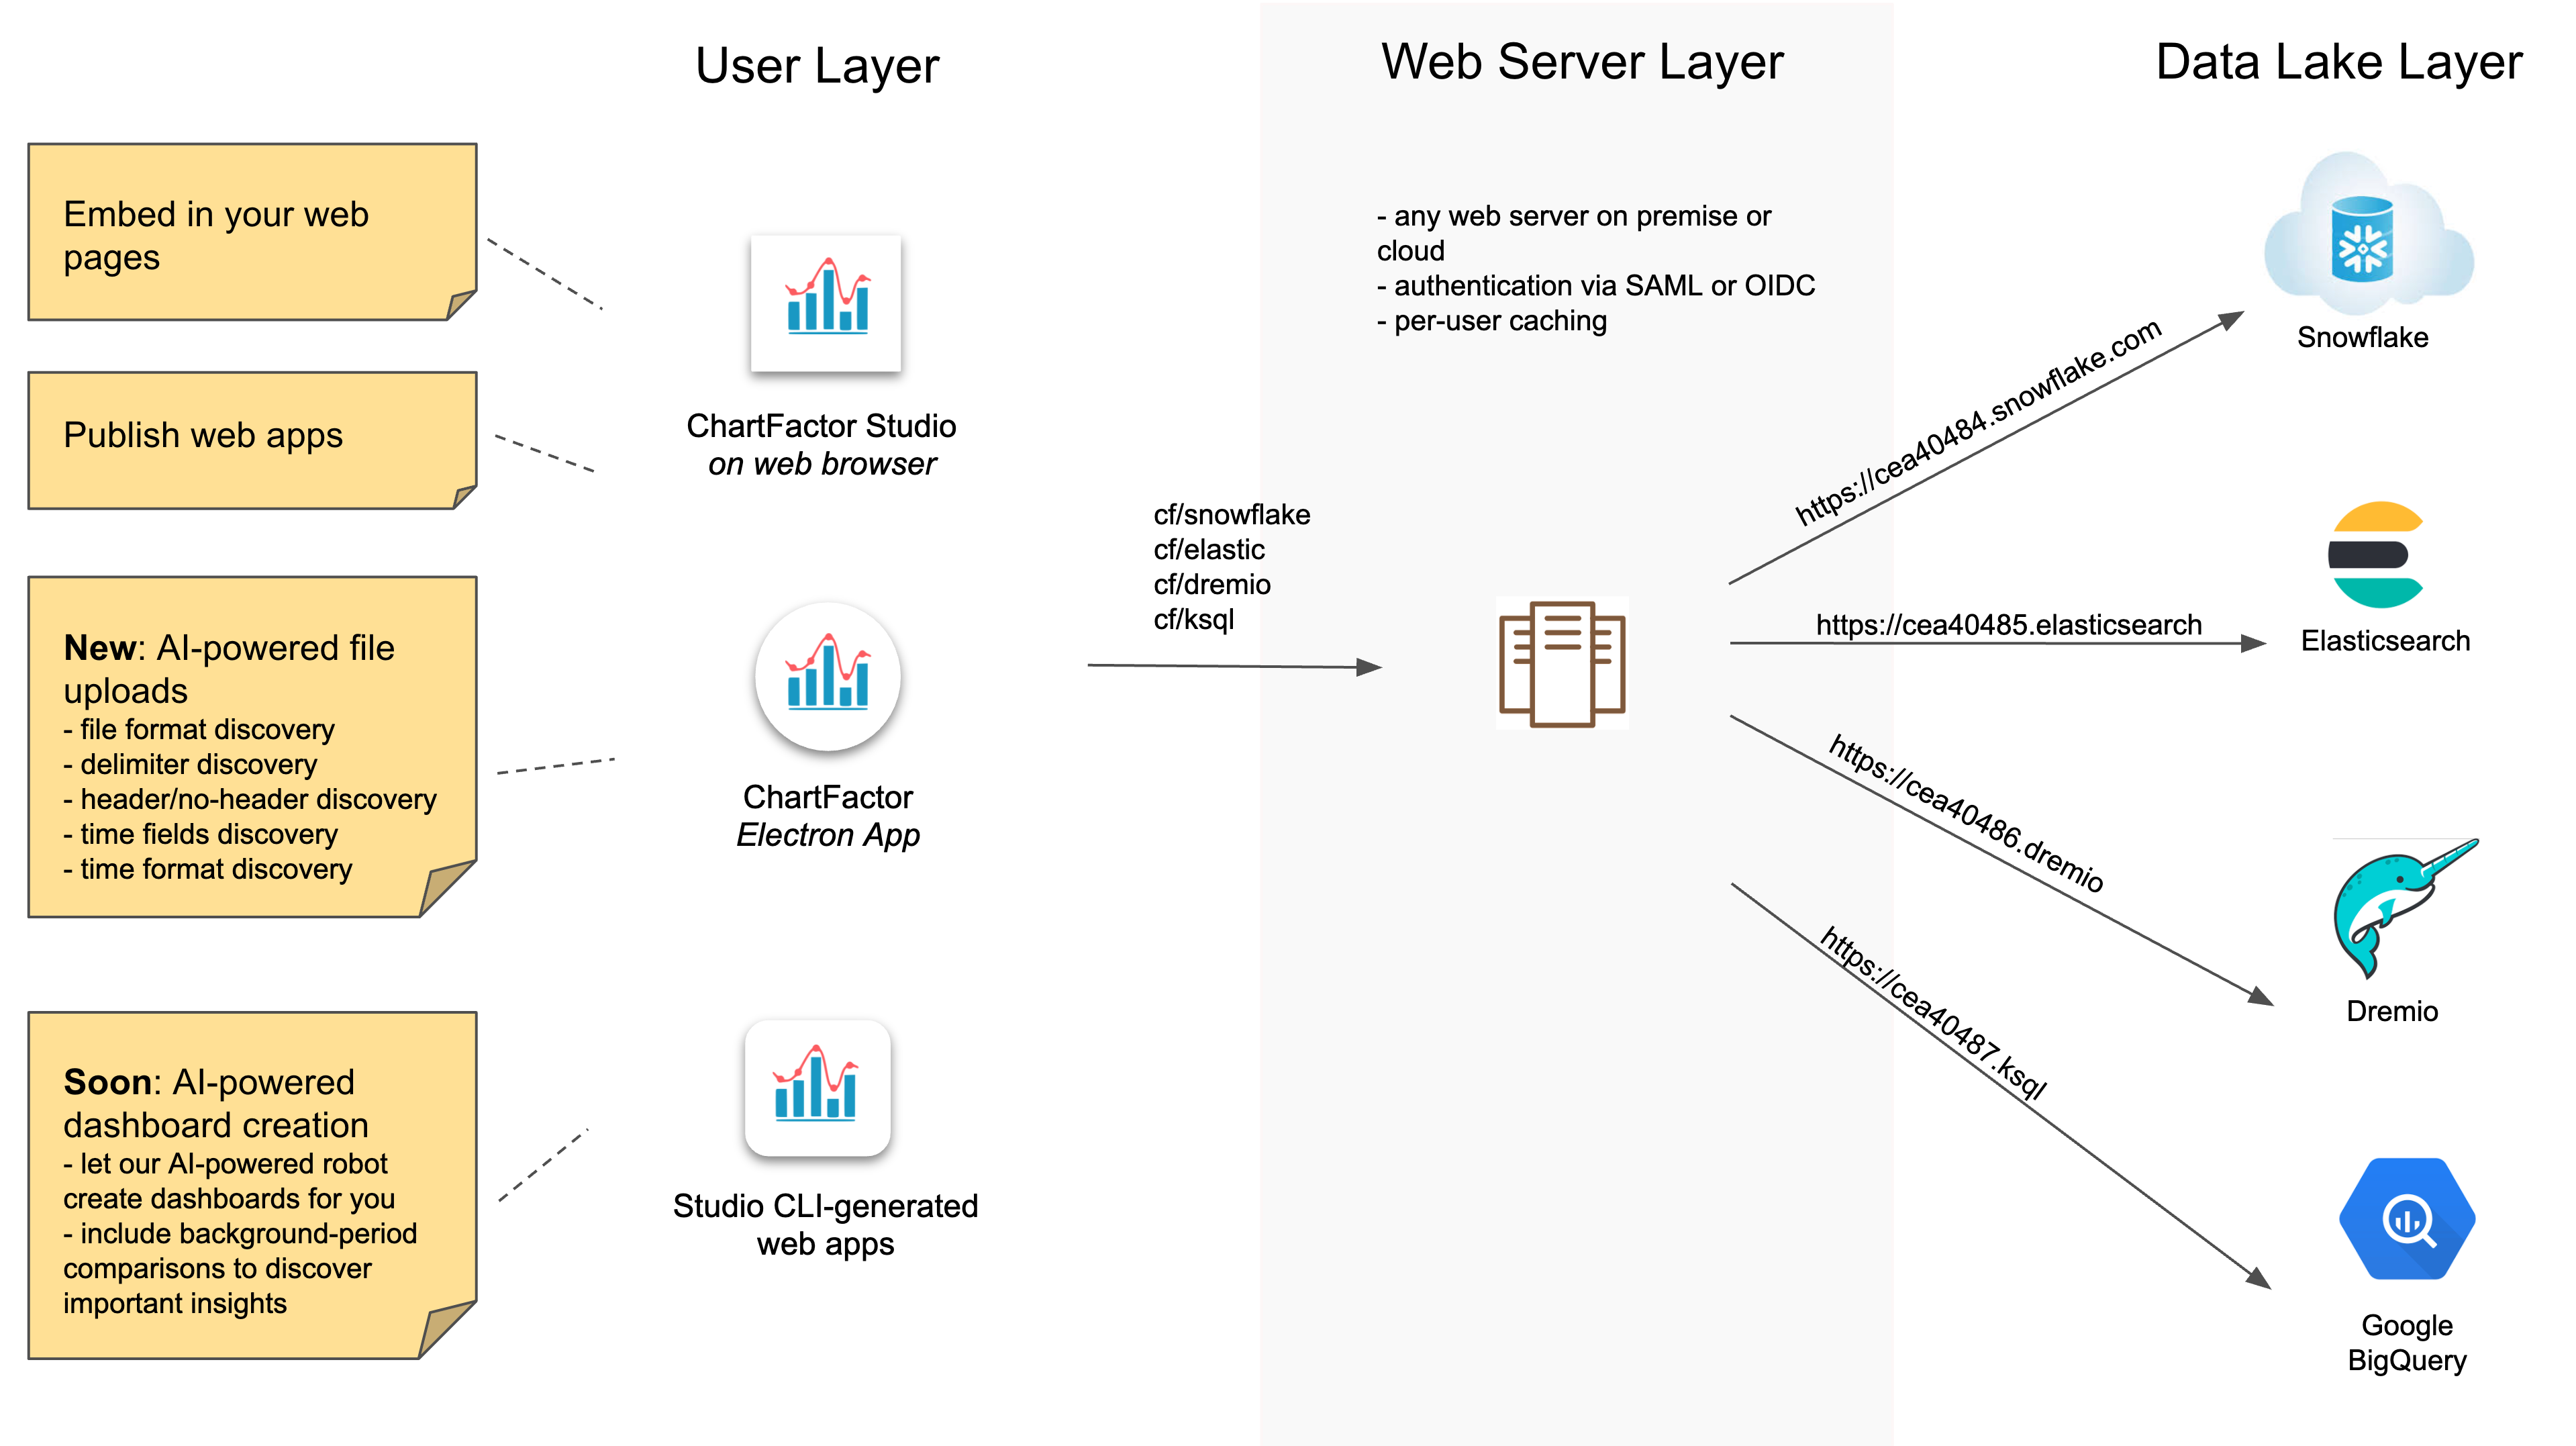
ChartFactor sample deployment diagram
The figure below depicts a ChartFactor deployment with some of its supported data engines.