Histogram
A histogram is an accurate representation of the distribution of numerical data. It is an estimate of the probability distribution of a continuous variable (quantitative variable). It differs from a bar graph in that a bar graph relates two variables, but a histogram relates only one. To construct a histogram, the first step is to “bin” (or “bucket”) the range of values —that is, divide the entire range of values into a series of intervals— and then count how many values fall into each interval. The bins are usually specified as consecutive, non-overlapping intervals of a variable. The bins (intervals) must be adjacent, and are often (but are not required to be) of equal size.
Using the following code we can create a basic Histogram:
1 2 3 4 5 6 7 8 9 10 11 12 13 14 | |
Previous code will render a Histogram like the one below:
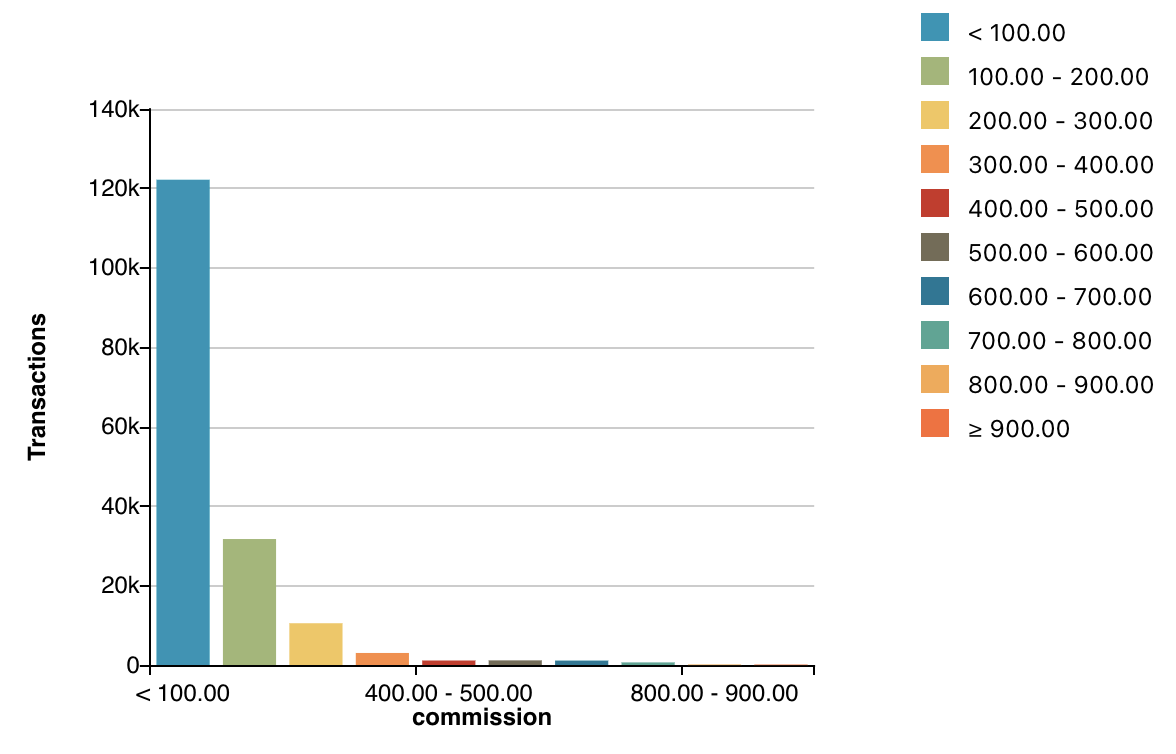
Special parameters
Metric parameters
fixedBars
It will try to display a fixed number of bars. It must be a positive decimal. If the bars rendered are less than the amount specified, then it means that there are some bars with zero transactions (count). See showEmptyIntervals. Defaulting behavior:
- If neither
fixedBarsnorintervalare specified, the histogram defaults tofixedBars(8) - If both
fixedBarsandintervalare specified, the histogram gives prescedence to theintervalvalue, that is, thefixedBarsparameter will have no effect if used together with theintervalparameter
Example:
1 | |
interval
It defines the interval to be used by each bar of the histogram. It must be a positive decimal. For example an interval of 10 will create bars from 0-10, 10-20, 20-30,.. etc. If some intervals are skipped, it means that they have zero transactions (count). See showEmptyIntervals.
1 | |
showEmptyIntervals
It allows to display all bars/buckets even if they have no transactions. Its default value is false.
1 | |
offset
The buckets can be shifted by using this option. It must be a decimal greater than or equal to 0 and less than interval. For example, if there are 10 documents with values ranging from 5 to 14, using interval 10 will result in two buckets, [0, 5), [5, 15). If an additional offset 5 is used, there will be only one single bucket [5, 15) containing all the 10 documents.
1 | |
Data parameters
limit
Limits the result of the query and that way the amount of bars rendered in the visualization. This parameter is specified to the chart aql, not to the metric.
1 | |
sort
The ordering criteria can be specified as follows:
1 | |
Chart options
As you can see in the picture above, the histogram by default shows "Transactions" as the label for the Y Axis since this is the default label for the count metric. You can change the label of the count metric globally using Custom Metadata. You can also display a custom label just for this histogram using the label option as shown below.
1 2 3 4 5 | |