Data Zoom
The Data Zoom option enables users to zoom into their visualization. You can enable this option by using the dataZoom setting. The dataZoom option has two modes:
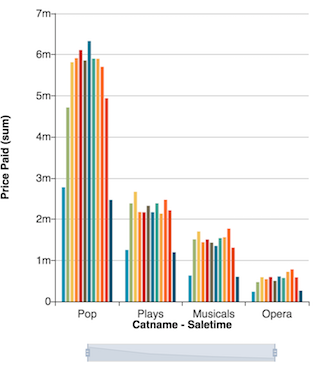
slider: This mode allows users to zoom in and out of the chart using a slider rendered at the bottom of the chart. Note that this option uses the chart's current data and it does not trigger data filters. This mode is also enabled if thedataZoomsetting is set totrue. See the picture below.
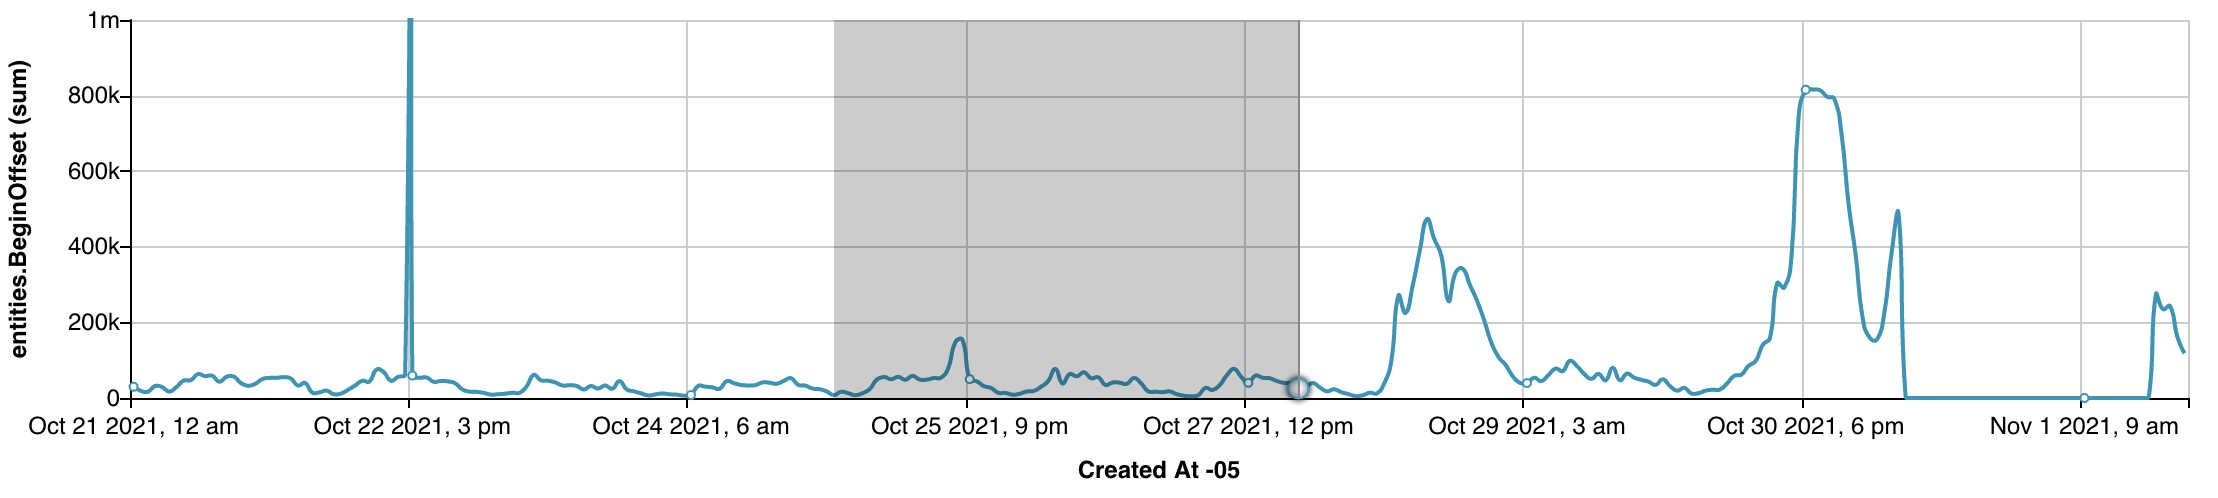
dragFilter: This mode allows users to select a range of values inside the visualization by using their mouse or by finger pinching. This option triggers data filters. See the picture below.
Support
The dataZoom option is supported by Bars, Trend and Area Line, and by the Multimetric version of each one of them. It is also supported by Heat Map.
Note
- For the Heat Map visualization, the
dataZoomoption only supports thedragFiltersetting.
The following are examples of how to set the dataZoom option.
1 2 3 4 5 6 7 8 9 10 11 | |