Tree Map
The Tree Map chart provides a hierarchical view of your data and makes it easy to spot patterns, such as which items are a store's best sellers. The tree branches are represented by rectangles and each sub-branch is shown as a smaller rectangle. The Tree Map displays categories by color and proximity and can easily show lots of data which would be difficult with other chart types. Tree Map charts are good for comparing proportions within the hierarchy. However, Tree Map charts aren't great at showing hierarchical levels between the largest categories and each data point.
The following code shows how to create a simple Tree Map using the ChartFactor Toolkit:
1 2 3 4 5 6 7 8 9 10 11 12 13 14 | |
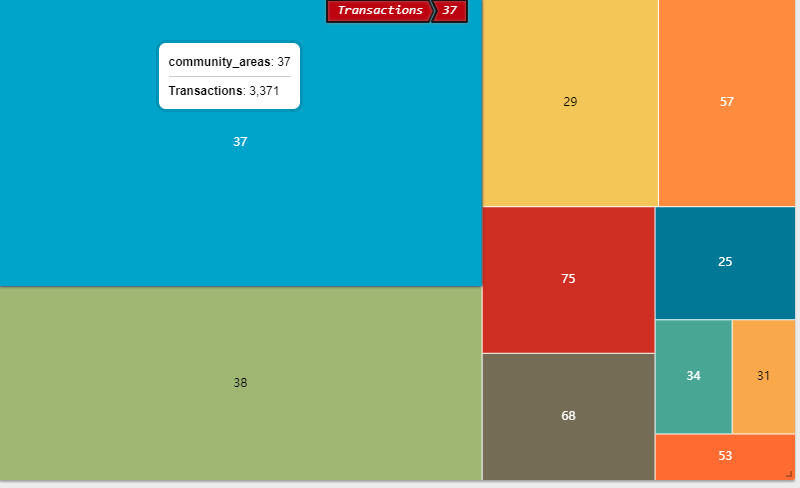
Previous code will render a Tree map like follow:
Serie label
The metric value (serie label) for each tile of the Tree Map is not visible by default. Please refer to the serie label documentation in the visualization options section for details on how to configure them.
Note
The formatter option in serie label doesn't take effect on Tree Map charts
Breadcrumbs
The Tree Map breadcrumbs show the path to the currently selected element. You can use the breadcrumbs property to hide these breadcrumbs or to configure how breadcrumbs should show. The value of the breadcrumbs property can be a string, boolean or object and you can set it using the .set() function. See the examples below.
1 2 3 4 5 6 | |
When using the object type, you can also set lots of additional properties as specifyed in the Echarts documentation for breadcrumbs.
The following code shows how to configure breadcrumbs using an object to specify several properties such as border color and text styles:
1 2 3 4 5 6 7 8 9 10 11 12 13 14 15 16 17 18 19 20 21 22 23 24 25 26 27 28 29 30 31 32 33 34 35 36 37 38 | |
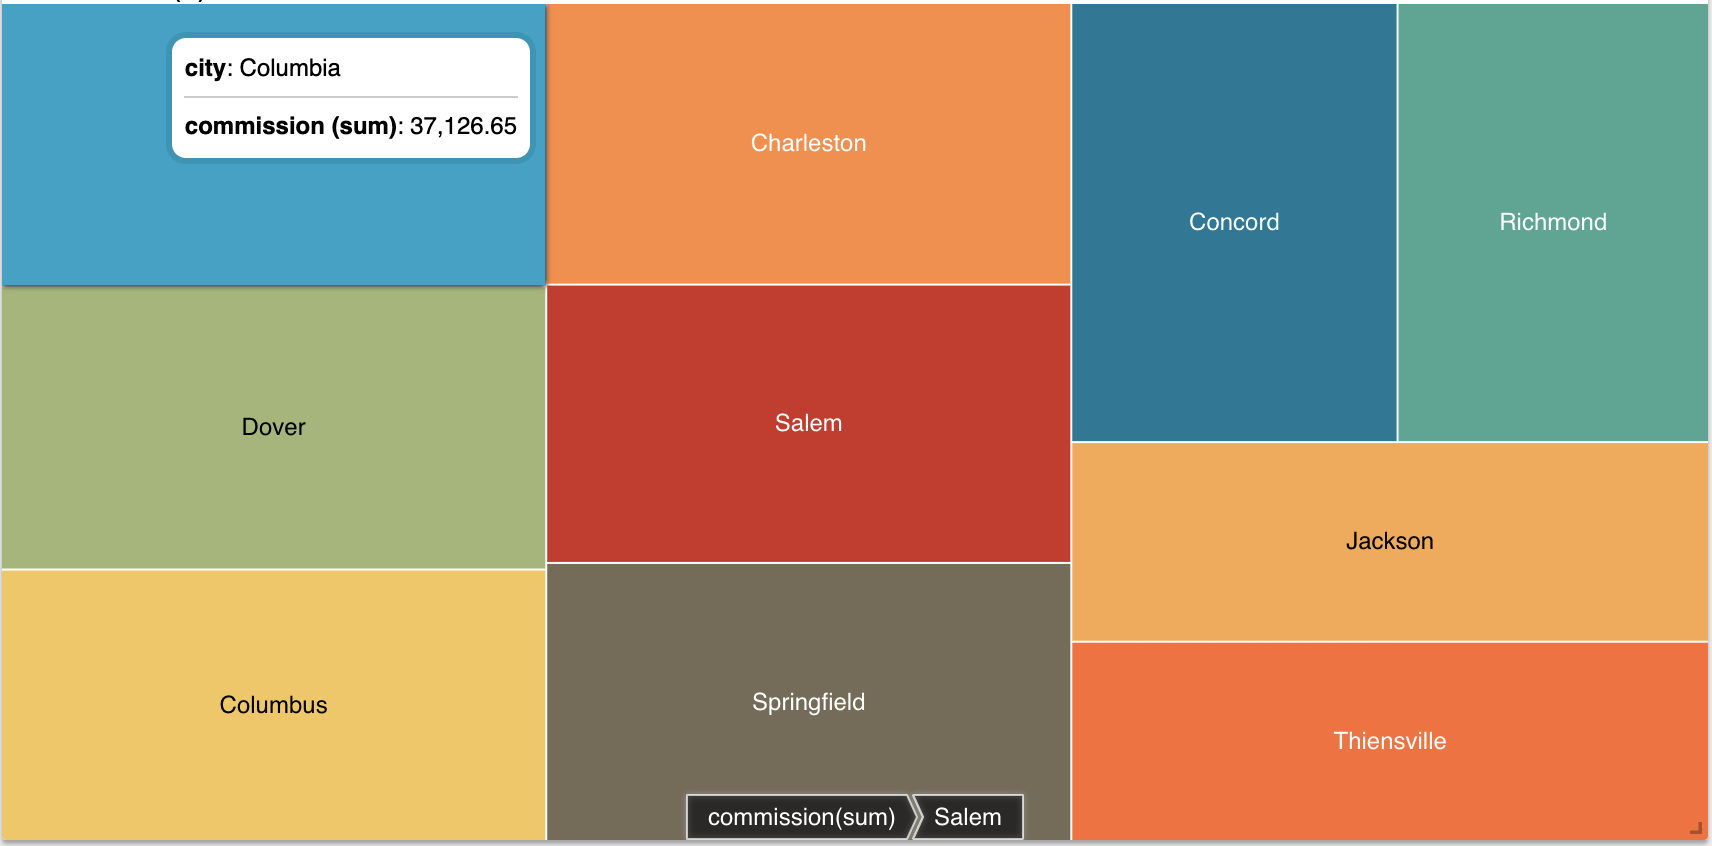
Previous code will render a Tree map with the breadcrumbs configured like follow: