ChartFactor Toolkit Architecture
Introduction
The ChartFactor Toolkit is an extensible JavaScript-based collection of modules that simplify the implementation of data applications that visualize and interact with data. We think of ChartFactor as having these capabilities:
- Through its visualization modules, it lets you add data visualizations to your web application, mobile phone, and any device that runs a modern browser.
- Through its data provider modules, it interacts natively with different data technologies. By that, we mean that ChartFactor can query your BI server, data streams, big data SQL and NoSQL engines directly. It can also interact with your home-grown server APIs because of its extensible Data Provider architecture.
- Through its interactivity module, it lets you add interactivity to your data applications to enable single-click filtering, drill-downs, drill-thrus, and complex interactivity rules.
- It provides a programming model that is easy to learn and understand
- It lets you configure your data visualizations in any way so that you can provide rich configuration options to your users. You can also extend ChartFactor with your own visualizations because of its Aktive Visualizations architecture.
What is the ChartFactor Toolkit good for?
The ChartFactor Toolkit is used in the following situation:
- You want to build interactive data applications and provide rich configuration options to your users
- You want to significantly reduce development and testing efforts to build your visualizations, query the data, bind results, handle user events, handle errors, format numbers, render labels, render tooltips, render legends, prevent overlaps. The list goes on and on.
- Your BI server or big data technology is fast enough and you want to query its data natively.
- You want your data application to leverage your existing security infrastructure. It uses your security token, cookie, and any other authentication/authorization mechanism used by your big data application, technology or service.
High Level Architecture
The following diagram summarizes the main ChartFactor Toolkit components which are discussed in this and next sections. 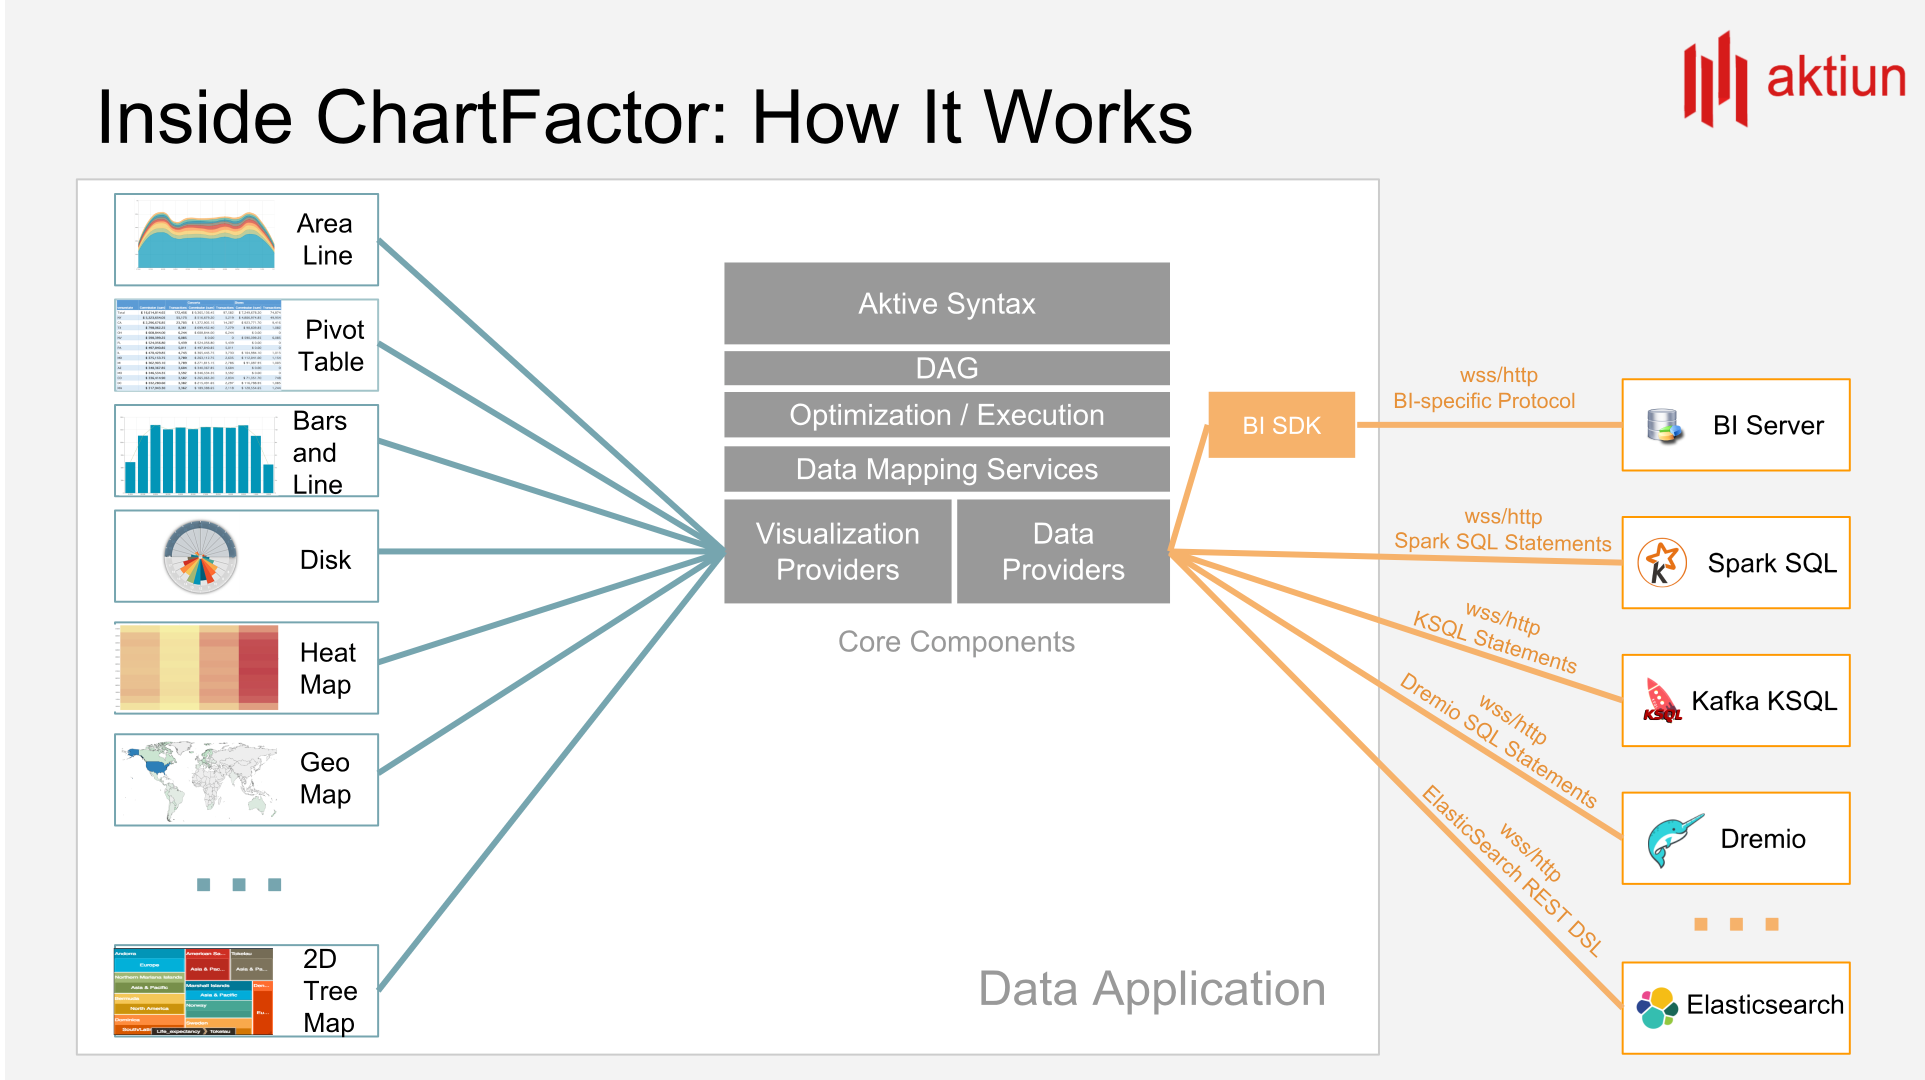 The ChartFactor Toolkit programming model allows developers to retrieve raw and aggregated data and to render this data in charts, while minimizing the need of async programming involving promises and function calls after promises are resolved.
Interactive data visualizations involve performing aggregation queries against data systems in an asynchronous way. When the data system responds, a callback or promise resolution function needs to map the data received to specific visualizations' data structures. At this point, the program also needs to perform the mechanics of rendering the visualization in a device display, using the technology available in the appropriate device. For instance, it could use SVG, Canvas, or WebGL when rendering on a web browser.
To simplify this programming model, the ChartFactor Toolkit makes use of a set of functions (Aktive functions) that allows developers to perform all needed data and visualization operations, sync and async, transparently, all at the same time.
The ChartFactor Toolkit consists of Provider and Visualization interfaces.
The Provider interface (e.g. data provider) includes functions to obtain raw or aggregated data from data systems. These are SQL-like functions we call AQL (Aktiun Query Language). The Data Provider implementation translates these function calls into technology-specific queries at execution time. Specific data providers can be plugged-in for different data system technologies.
The Visualization interface exposes visualization-specific settings that affect the shape, size, color, and other characteristics of the chart.
The ChartFactor Toolkit operations can be classified in two types: transformations and actions. On the data provider side, transformations determine how data is grouped, sorted, limited, what metrics are aggregated, what operations are performed for the aggregation. On the visualization side, transformations determine what type of chart is rendered, if legends are displayed, where legends are displayed, if labels are rendered, and many other options.
Transformations in the ChartFactor Toolkit are lazy in that they do not try to execute or obtain results right away. Instead, they just remember the transformations applied. Transformations are executed when an action requires the data to be obtained for the visualization to be rendered.
Actions execute all transformations in an efficient way, including querying the data system, waiting for the data to be returned to the driver program, and rendering visualizations according to previous Aktive commands. The main "action" command in the ChartFactor Toolkit is execute().