Comparative Metrics
Comparative metrics allow users to compare a metric across time periods, against categories, groups, or competitors to understand how they are behaving.
ChartFactor provides several ways to compare metrics with very little effort. Two modes are available:
- Filter-driven
- Standard (not filter-driven)
Filter-driven comparatives require a specific filter to exist to calculate comparative values. If the filter is not applied, the comparative calculation does not take effect.
The standard (not filter-driven) mode aplies to rates and does not require filters to take effect. We discuss Standard Rates in detail here.
The CompareMetric object
With this object we can create different types of comparatives such as time periods, rates, and benchmarks.
1 2 | |
In the example above we created two comparatives, one for count and one for price. Notice that they are created in the same way as the classic Metric objects, and they are applied to the visual in the same way:
1 | |
It is important to mention that a comparative metric will create one or more additional queries depending on the type. This is because it needs to obtain the main value and the comparative value.
We can condition the metrics with more properties depending of what type of comparative we want to obtain. Let's take a look at them:
Time offset
This is a very common type of comparison: We have the behaviour of a metric in a time window and we want to compare it with the same metric in a different time window. This is usually seen in a trend chart:
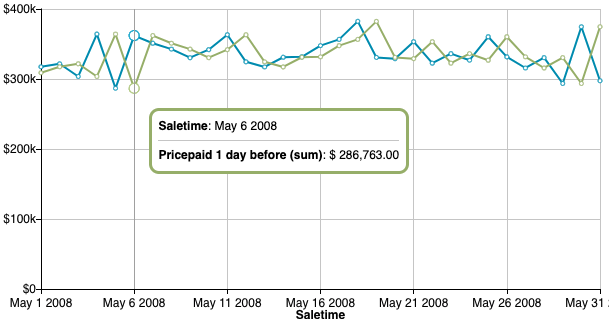
The example above shows two lines in the trend: the green-blue is a standard metric, the light-green is the same metric with an offset of -1 day:
1 2 3 4 5 6 7 8 9 10 11 12 13 14 15 16 17 18 19 20 21 22 | |
The using() property specifies the name of the filter attribute that is going to be used for the comparison.
The with() takes the offset as a parameter. An offset is specified with an integer and a time unit like: '-2 months', '1 year', '3 days'. The offset will be added or substracted to a given range (the range of the filter) depending if it is negative.
Integer fields
Regarding the .using() property, time offset comparative metrics are meant to be used with time fields. Integer fields that represent years (a four digits number) are also supported since this is a common situation in data sources, but with certain limitations:
- You can only use offsets as
years, so4 months,2 days, etc. are not allowed - Only one specific filter value (e.g. year) is supported. When multiple consecutive or non-consecutive filter values are selected, only the first filter value will be used. For example, if 2012, 2013, and 2019 are applied as filters, only 2012 will be used to calculate the offset.
Pivot Table support
This metric is supported by the pivot table. The position of the time field won't matter as long as it is included and it matches with the time filter. If we have a pivot configuration like this:
1 2 3 4 5 6 7 8 9 10 11 12 13 14 15 16 17 | |
1 2 3 4 5 6 7 8 9 10 11 12 13 14 15 16 | |
Rate
Rates show how much a given value represents (proportion) when compared against a bigger set where it belongs to, for example the revenue of a brand against the rest of the brands within a given category.
We identify a comparative as rate with the property .rate()
1 2 3 4 5 6 7 8 9 10 11 12 13 14 15 16 17 18 | |
brand exists in the query, the execution triggers another query without that filter to obtain the same metric for all the other brands so it can calculate the rate.
The rate is by default a percent and it is calculated like this:
brand_value * 100 / all_brands_value.
Raw Value
If we need to render the denominator (the value for all_brands_value) as a separate metric, we use the string raw as parameter for the .rate() property:
1 2 3 4 | |
Pivot Table support
This metric is supported by the pivot table. To make sense of the results, the rows and columns should only include fields with a relation of one to many against the field used in the comparative. For example:
Category name (catname) belongs to one category group (catgroup), but it may have more than one event (eventname):
1 2 3 4 5 6 7 8 9 10 11 12 13 14 15 16 17 | |
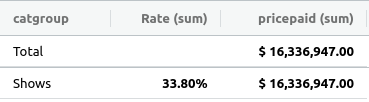
The result is that the category name Musicals represents the 33.8% of all category names within Shows:
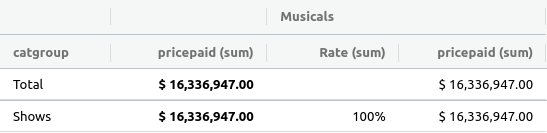
By including catname or eventname as rows or columns, the result will be of course 100%:
Growth Rate
This is variation of the rate that shows how much a metric has increased or decreased comparing to periods of time. It is a mix of time offset and rate.
We need to use .rate() and pass the string "growth" as a parameter. We also need to specify the time offset and the filter that will be used for the comparison:
1 2 3 4 5 6 7 8 9 10 11 12 13 14 15 16 17 18 19 20 21 22 23 24 25 26 27 28 29 | |
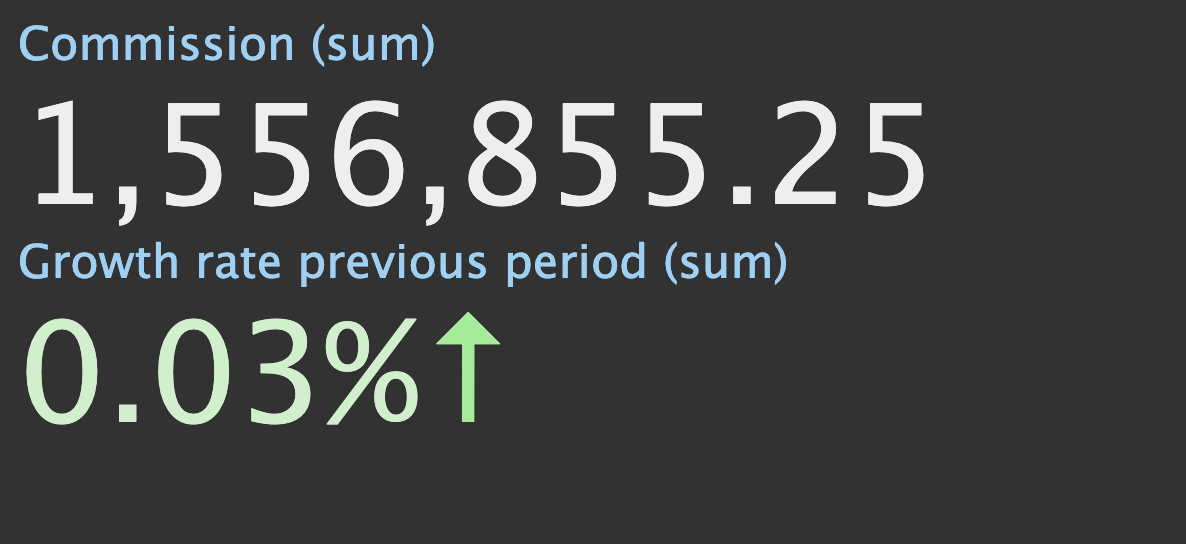
When the time filter saletime exists, the execution triggers another query to obtain the data for the same filtered period minus 1 month, so that it can calculate the commission growth rate as follows:
Being CP current period and PP previous period, the rate of growth is
1 | |
This comparative metric has the same limitations as the time offset when used with integer fields representing years as explained here.
Pivot Table support
Grothw rate follows the same instructions as time offset for pivot support instructions.
Standard Rate
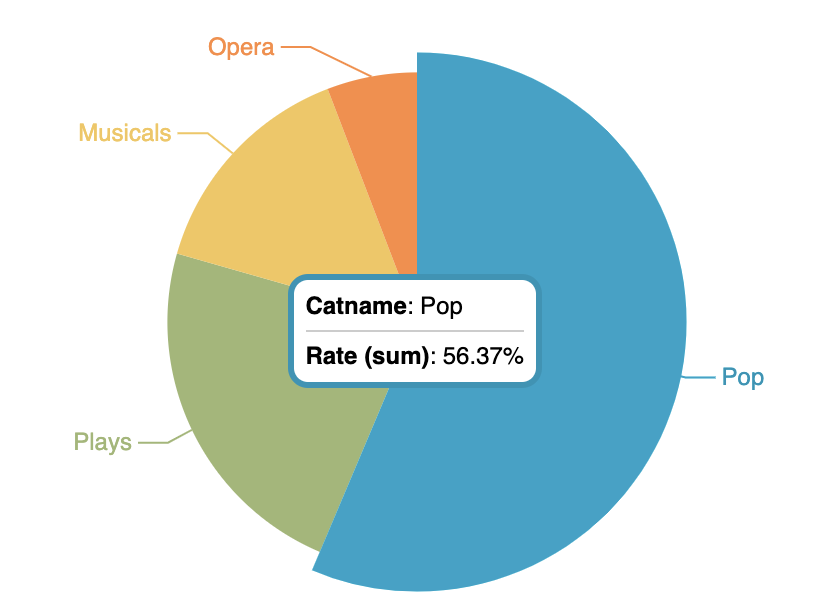
The rates we've analyzed so far are obtained when a filter matching the .using() property exists. But let's say we want to display a Pie chart with categories and see the rate for each one of them, without applying any filter. To obtain this, we just need to specify the same attribute in the group-by and in the .using() property:
1 2 3 4 5 6 7 8 9 10 11 12 13 14 | |
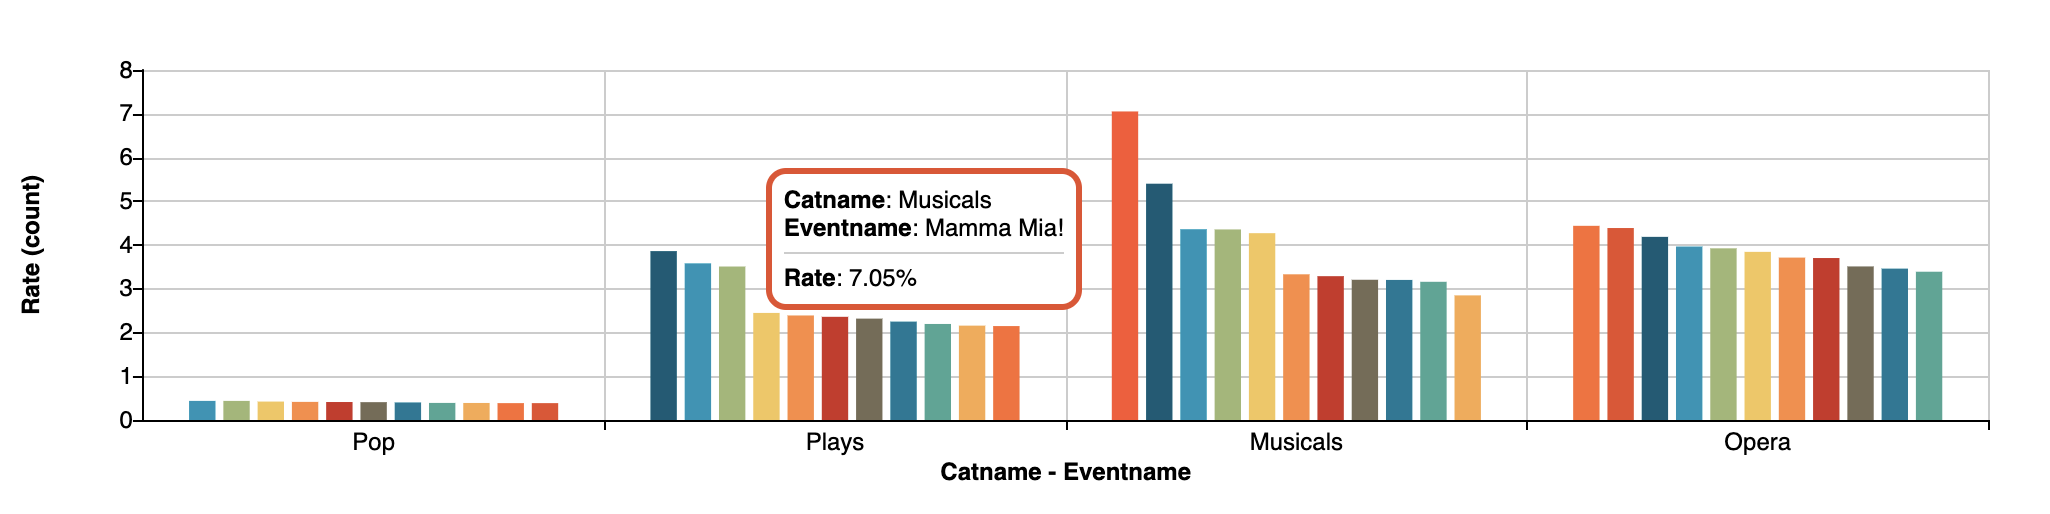
We could also group by category and events, and we would like to see the rate for each event against the total of the category where it belongs to. In that case we need to pass both groups names as parameters to .using():
1 2 3 4 5 6 7 8 9 10 11 12 13 14 15 16 | |
Pivot Table support
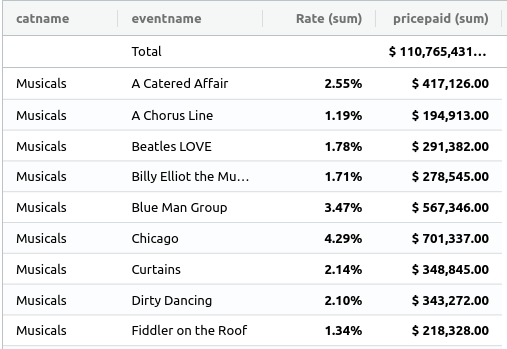
Similar to the filter driven rate, the order of the fields are important so the result can make sense. For this metric the order of the fields should be from low cardinality to high, so using the same example with catname (low cardinality) and eventname (high cardinality):
1 2 3 4 5 6 7 8 9 10 11 12 13 14 15 16 | |
Same values as the above would be obtained if eventname is used as a column.
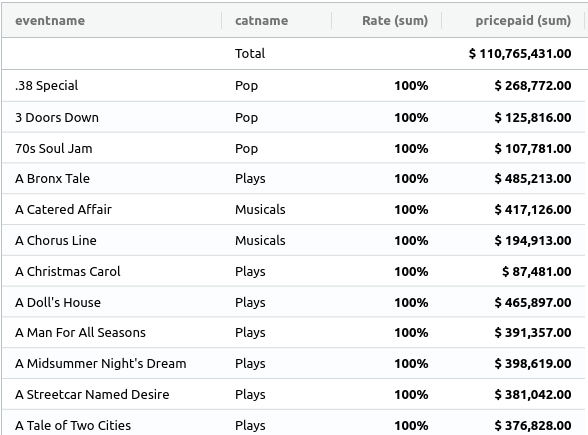
In case a the eventname is used before catname, the result will be that the rate of each value represents the 100%.
1 | |
Benchmark
Benchmark metrics represent the performance of an attribute (a brand, an institution, an event) compared to the others, usually within a category.
To use the comparative of type benchmark, we add .benchmark() to the compare metric definition, and as a parameter we specify what type of operation we want to use for that benchmark. Operations are the classic metrics functions we already know: sum, avg, min, max, unique and unique_approx.
So let's say for example we have a category called "Plays" and we have several events that fall into that category, and we want to analize the revenue of the play "Macbeth" compared to the average of the category:
1 2 3 4 5 6 7 8 9 10 11 12 13 14 15 16 17 18 19 | |
If we use a Multimetric Bars to display this two metrics, we'll have something like this:
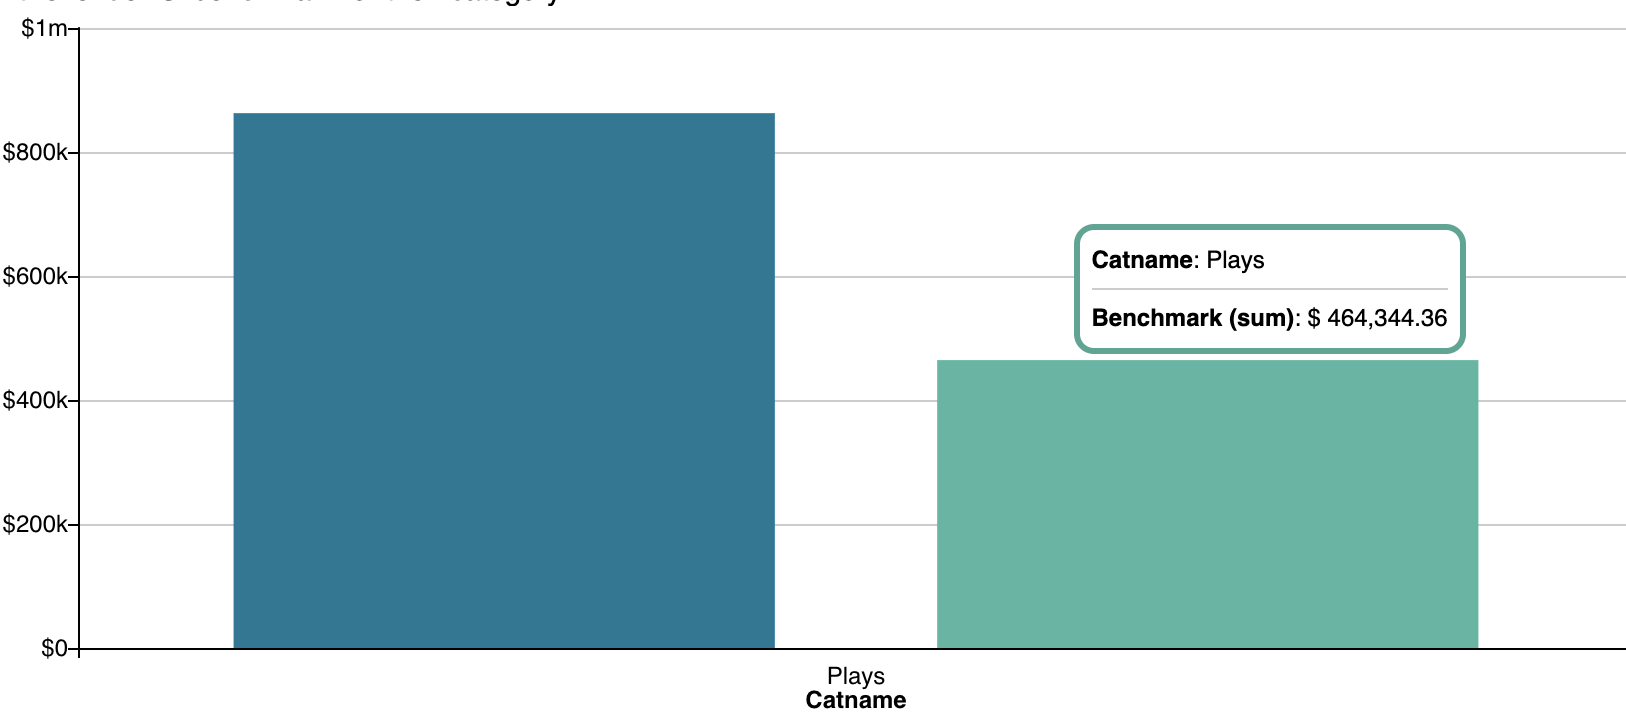
We can see that the average of revenue for all events in "Plays" is less than 500k, and Macbeth's revenue was over 800K, meaning way it performed way better than the average.
Notice that the filter that drives the benchmark comparative was specified with the property .against(). Even though .using() can be also used for benchmark metrics to specify the filter, is not recommended since it may be confusing if we need to use then the "Rate Benchmark" comparative explained in the next section.
Pivot Table support
Results for benchmark in the Pivot Table are also driven by the order of the fields and if they match or not with the .using() property:
1 2 3 4 5 6 7 8 9 10 11 12 13 14 15 16 17 | |
This will render a Pivot Table like this:
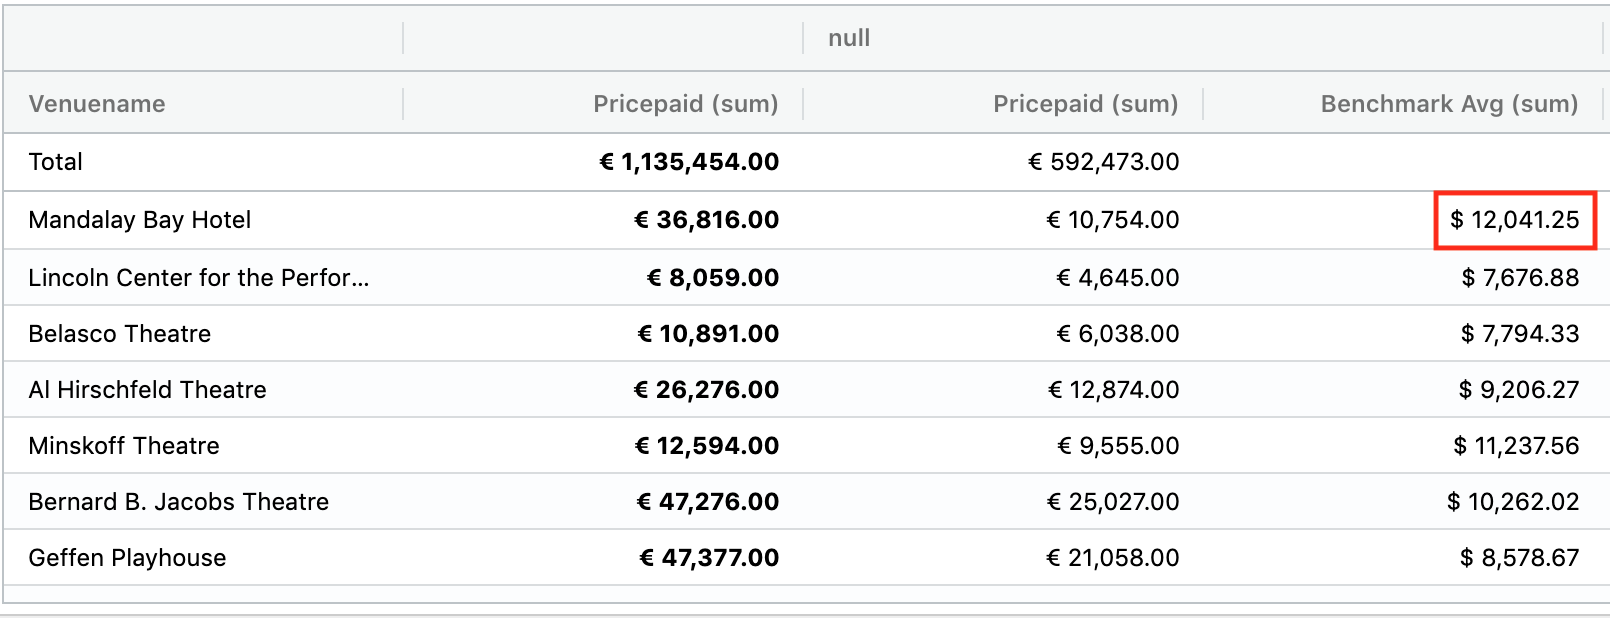
The benchmark value for the venue Mandalay Bay Hotel for those who didn't vote if they liked rock or not (null) is 12,041.25.
In the case above the field eventname was not included in the rows or the columns, however same result can be obtained if we include it in the aql in any of the following ways:
As the first column:
1 2 3 | |
Or as a third row:
1 2 | |
In any of the above ways, eventname is always after venuename and likerock.
But if we changed change the position of eventname to be used as a second row :
1 2 3 | |
The benchmark values will be different:
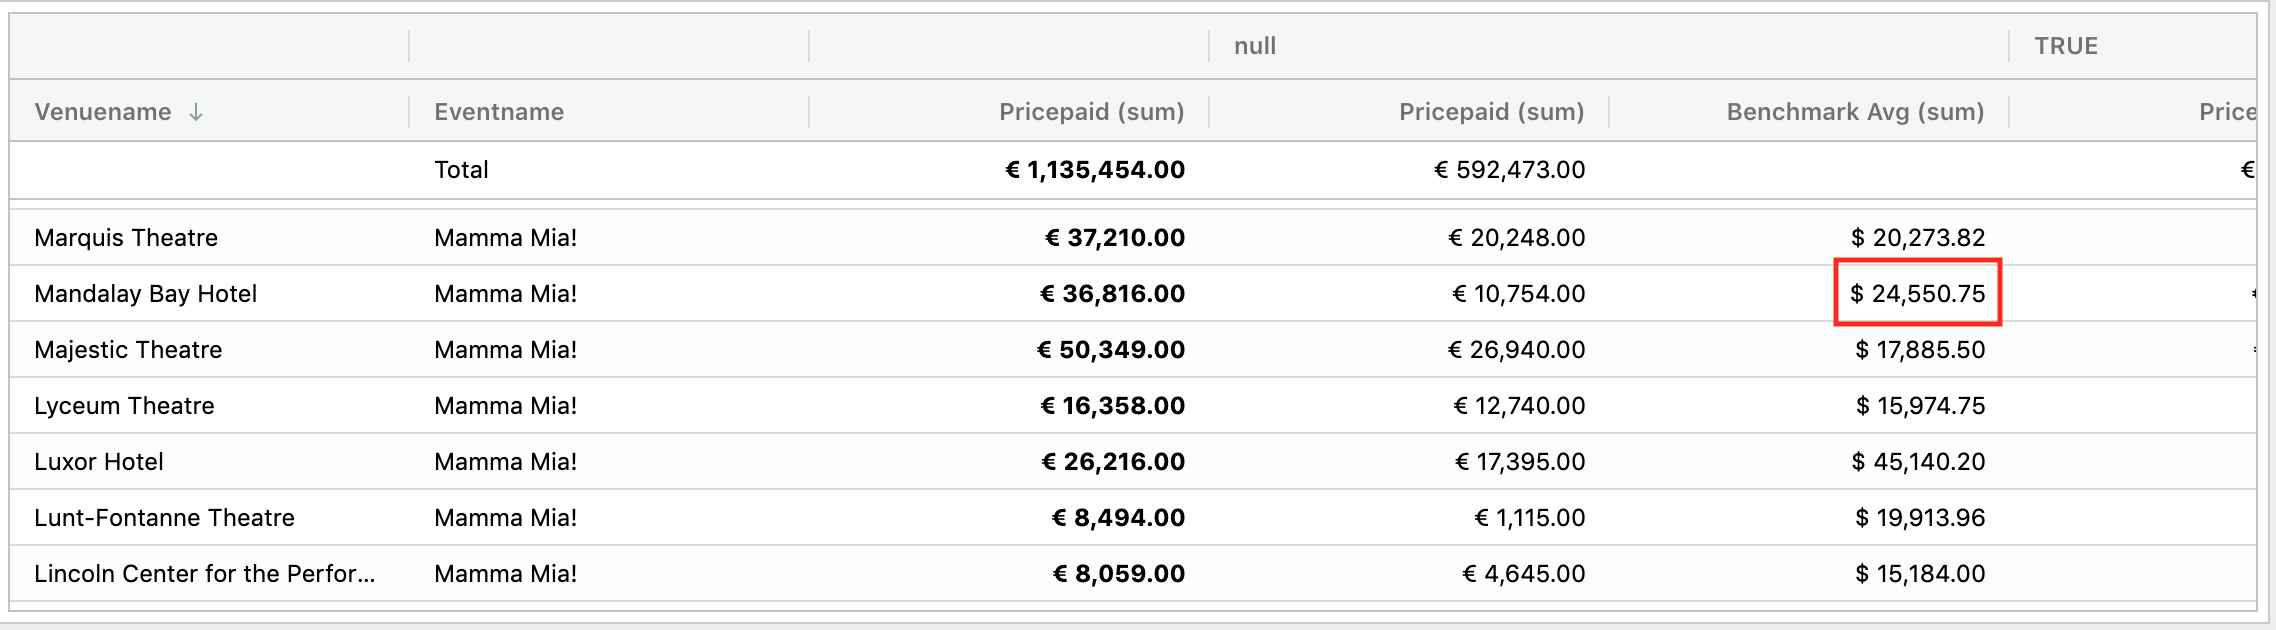
Value for Mandalay Bay Hotel in the column null of likerock changed this time to 24,550.75.
The point of this section is to highlight the importance of the field's position when building the Pivot Table to avoid unexpected results.
Rate Benchmark
This comparative metric is a combination of both as the name indicates in one. Basically it allows to obtain benchmarks over rates. The rate benchmark will be rendered as two separate metrics for the end result.
For the case of this comparative, two filters are required. The first one is the one that defines the rate and is set with the property .using(), the second one is for the benchmark and is set with .against().
So using the same example used for the benchmark, let's say you survey people who purchase tickets to know their preferences. Specifically, you'd like to know if they like musicals or not. Then you'd like to know the rate of people who like musicals AND attend Macbeth compared to the benchmark rate for the "Plays" category:
1 2 3 4 5 6 7 8 9 10 11 12 13 14 15 16 17 18 19 20 21 22 23 24 25 26 27 28 29 30 31 32 33 | |
And you will obtain the bar chart below. The picture below shows the tooltip over the rate of people who purchased Macbeth and like musicals:
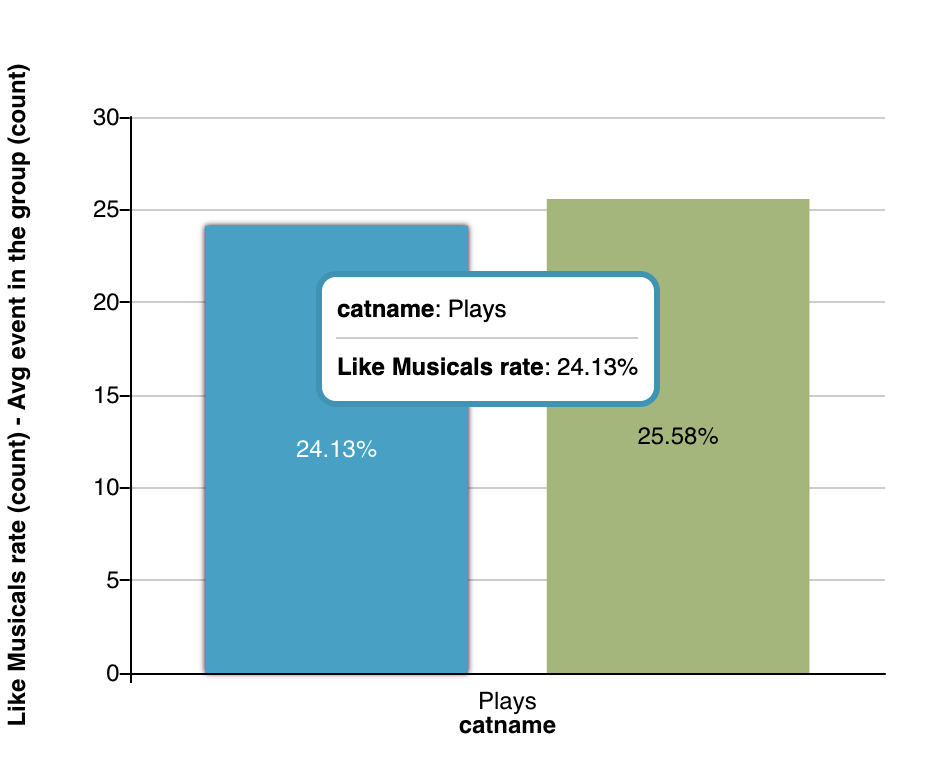
This second picture shows the same bar chart but with the tooltip over the benchmark rate for the "Plays" category:
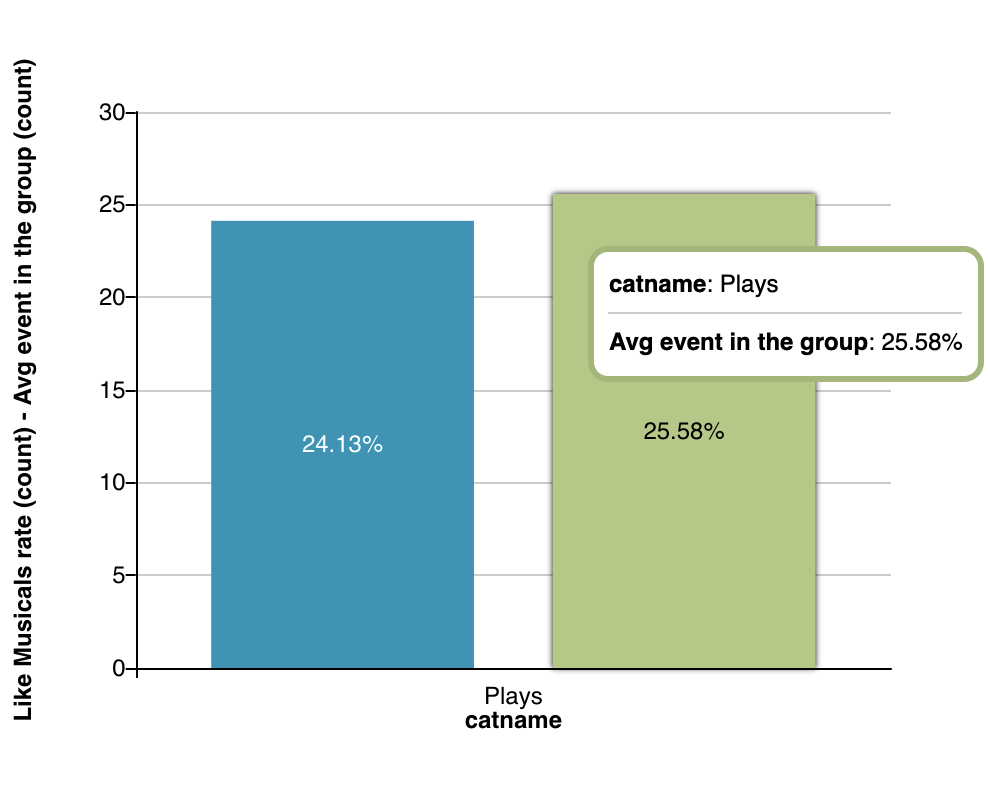
As we saw in the code example above, the first filter is Likemusicals and is the one that is used to get the rates. The benchmark is done over the rate for an event (Mactbeth) against the category "Plays"
Note
The order of the properties must be respected for this compare metric: Rate must be before benchmark, otherwise just rate will take effect and labels can be also overwritten.
Pivot Table support
This comparative metric is not supported in the Pivot Table.
Using multiple metrics
Comparative metrics can be used as any other metric so we can add several metrics to the same aql.
Restriction on comparatives
Comparatives have some restrictions on how they can be used. These are:
- Growth rate cannot be used in multigroup top-n queries.
- The Rate Benchmark metric (the combined metric only) cannot be used in any type of multigroup query (top-n or pivot).
- No comparative can be used as sort in multigroup top-n queries.