Field Selector
The Field Selector allows you to interactively change fields for a group of visualizations. This enables the analysis of several attributes and metrics without having to manually modify the aql for each of the charts.
The most basic declaration of the Field Selector is as follows:
1 2 3 4 5 6 7 8 | |
The above code creates a simple input field that, when clicked, opens a list of fields as shown below:
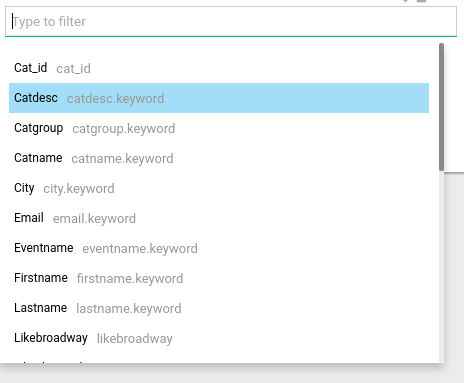
You can type within the text input to filter the list of fields.
Selecting a field
When you select a field using the Field Selector, all visualizations matching the ids specified in charts will change their selected field. The default behavior is as follows:
- For all visualizations except Trend and Area Line, the first group or metric will be changed
- Since Trend and Area Line use two groups where the first one is an attribute and the second one is a time field, the Field Selector will automatically match fields of type
ATTRIBUTEwith the first group andTIMEwith the second. - The new group or metric will keep the old configuration (limit, sort, function) unless you specify a different configuration
- Integer can be used as Attribute or Metric. See Specifying what field is affected
The default behavior can be modified using the options specified in the next section.
Options
Filter by type
You can specify the types of fields that appear in the Field Selector list by providing an array of types. Example:
1 | |
Or if you want metrics:
1 | |
If not specified, the default is ['ATTRIBUTE']
Filter by specific fields
You can also narrow down the list of fields by providing an array of field names:
1 | |
fields option is used then the type option has no effect.
Default field
To load the Field Selector with a field already selected:
1 | |
The default field won't show if not found in the list of predefined fields when using the fields option or if the default field's type does not match with the types specified when using the type option.
Specifying affected fields
When users select a field, by default the Field Selector updates the first group or metric of the selected charts. When charts have more than one group or metric, you can specify what group or metric should be changed like this:
1 | |
or for the metrics:
1 | |
The INTEGER type can be used as a group or metric because it can represent an id, day of week, year, etc. To use the INTEGER type as attribute:
1 2 | |
Extending options for attributes
When selecting a new attribute or time field, we can specify new configurations to override the current ones.
Using a different sort for the new field:
1 2 3 | |
Or if we want to use the selected field as sort by (alphabetical sort):
1 2 3 | |
If the chart is currently sorted alphabetically and we want to keep it in the same way for the new selected field, then we don't need to specify a sort since the Field Selector will recognize it and use the newly selected field also as the sort by.
Using a new limit:
1 | |
Using a different granularity when using fields of type TIME
1 | |
Extending options for metrics
If we are using metrics, a new function can be specified for the new metric:
1 | |
Non supported visuals
All visuals are supported except for those that don't use the .groupby method such as Pivot Table, Raw Data Table, Sankey, and Sunburst.
Events
The visualization triggers the field-selected event everytime a field is selected as the name states. The event properties are:
1 2 3 4 5 6 | |