Multimetric Trend
The Multimetric Trend as it names indicates, allows to trend multiple metrics over time. It requires one field of type TIME and at least one metric, but it's true usability comes when displaying several:
1 2 3 4 5 6 7 8 9 10 11 12 13 14 15 16 17 18 19 | |
The previous code will render the Trend Chart below:
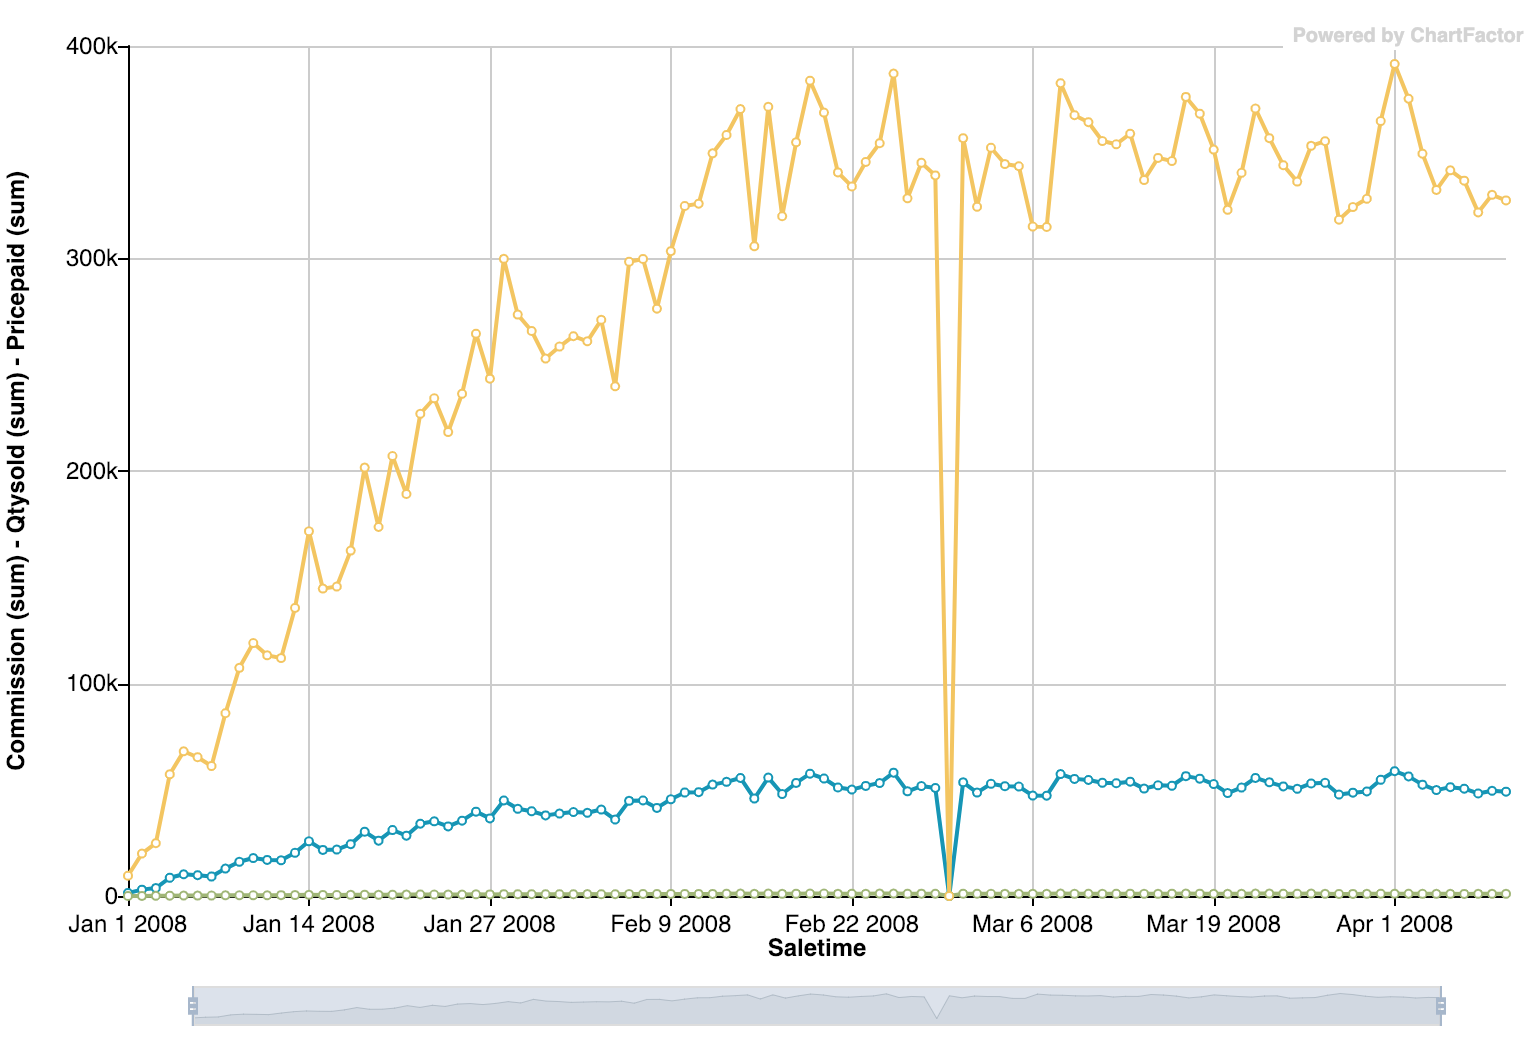
All filters over the Multimetric Trend are always applied as normal filters.
Dual Y-Axis support
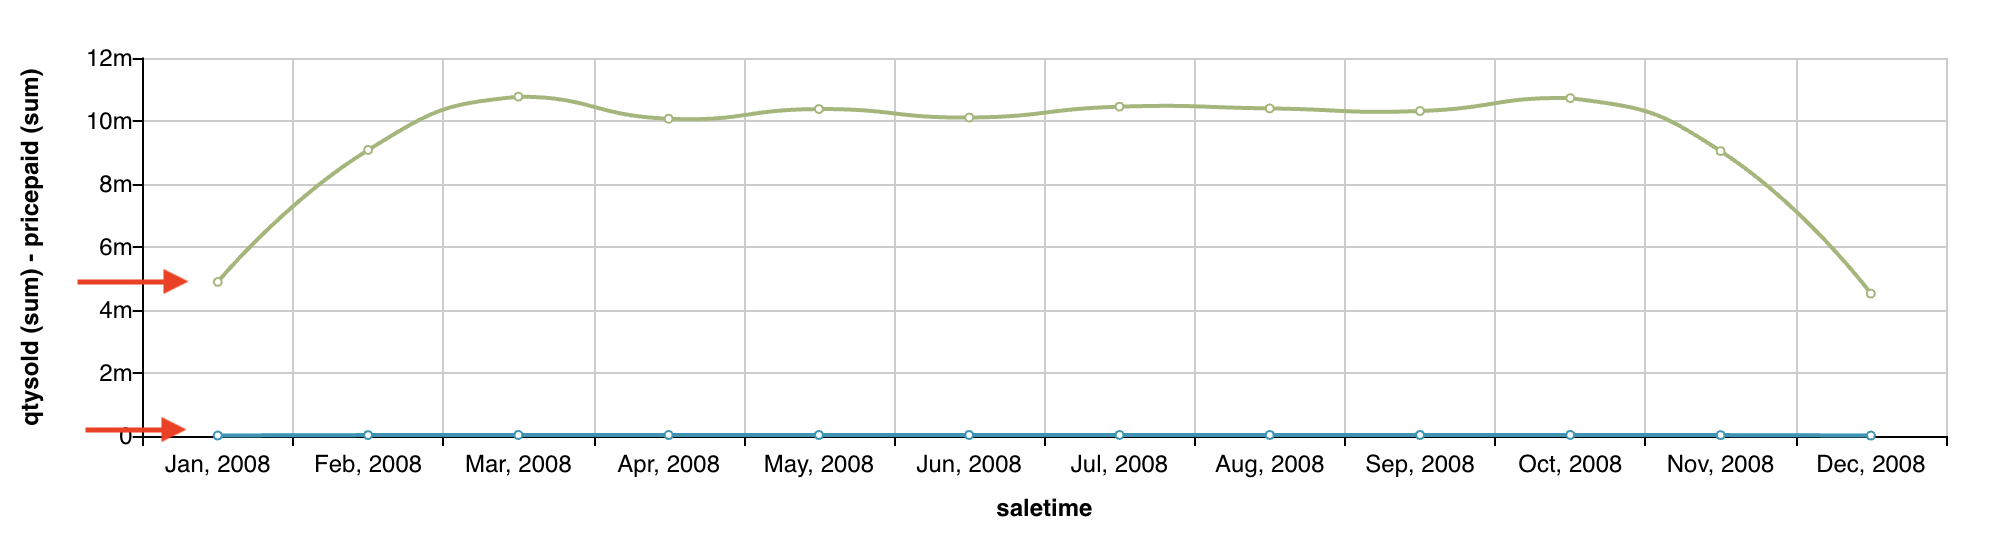
The Multimetric Trend supports a dual y-axis which is useful when the metrics have different scales. To illustrate, the example below uses only one y-axis to visualize both qtysold and pricepaid metrics. Note that the qtysold line is flat at the bottom of the chart because the sum of its values are way smaller compared to the sum of pricepaid for each month.
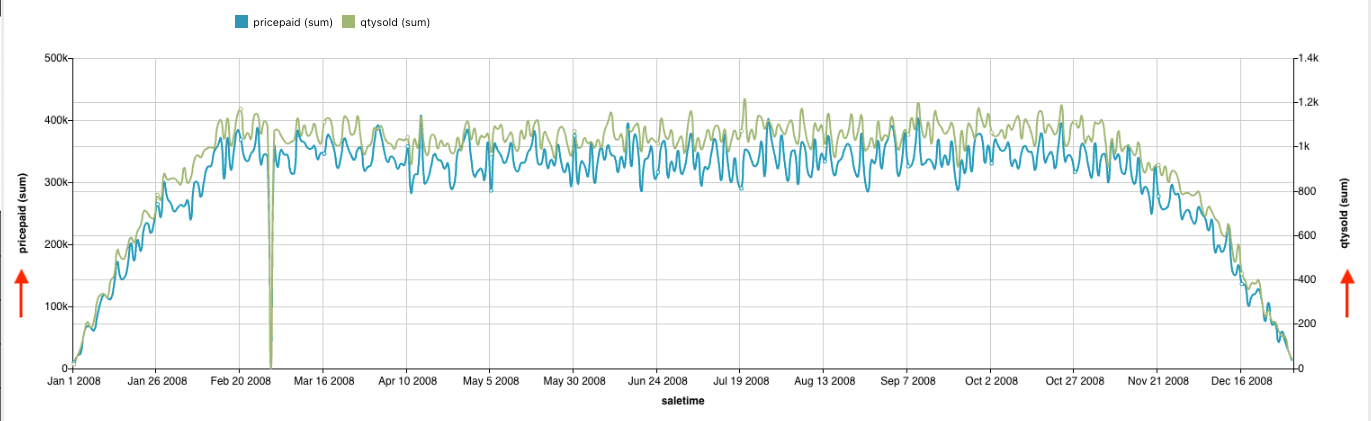
To select the metric y-axis, you need to set the position property of cf.Metric object to left or right. See the example below where we set the qtysold metric to use the right y-axis:
1 2 3 4 5 6 7 8 9 10 11 12 13 14 15 16 | |
With this configuration, the left y-axis shows the pricepaid metric scale and the right y-axis shows the qtysold metric scale. The image below shows the Multimetric Trend with the configured dual y-axis:
Configuring axis options for dual Y-Axis
When the dual y-axis is enabled, the axis settings should be an array of objects where the first object is the left axis and the second object is the right axis. The configuration options are the same as the ones specified in the Axis Options page. The following example illustrates how to set the scale label rotation for the left and right axis:
1 2 3 4 | |