Tooltips
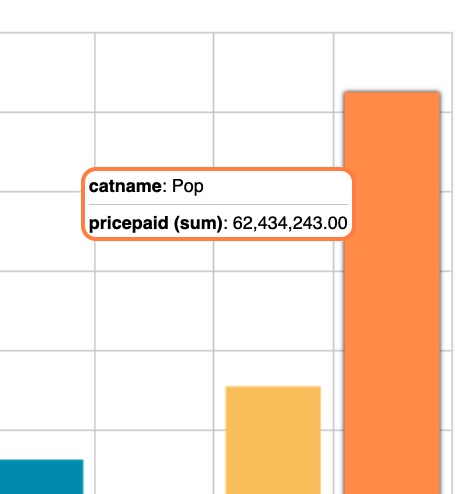
All the visualizations within the standard library have the option to override their tooltips. Let's take a bar chart for example. A tooltip like the one below is rendered when hovering on one of the bars.
If we need to modify the tooltip content, we can create a function that sets a new HTML string to the ChartFactor tooltip object:
1 2 3 4 5 6 7 8 9 10 11 12 13 14 15 16 17 18 19 20 21 22 23 24 25 26 | |
The above configuration will render tooltips as shown below:
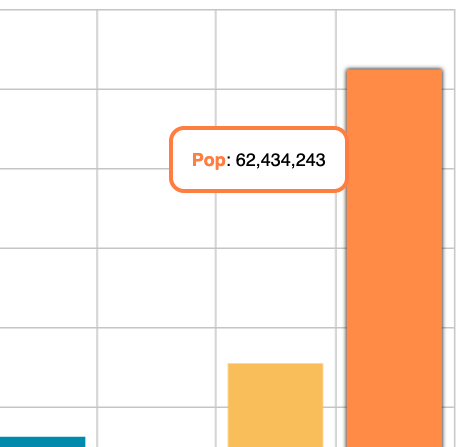
Tooltips can be enriched with the information passed to the tooltipBuilder function.
Parameters passed to the tooltipBuilder function
data: A JSON object with the data of the hovered canvas object. In this case the orange bar.
originalTooltipHtml: As the name states, it is the default HTML string created by ChartFactor. If we set this HTML instead of the new one, the result is the same as the original.
visConfig: The JSON configuration for the visualization. It's the equivalent to: cf.getVisualization('id').get()