KPI
The KPI chart allows users to visualize a specific metric and optionally a comparison metric and the difference between them.
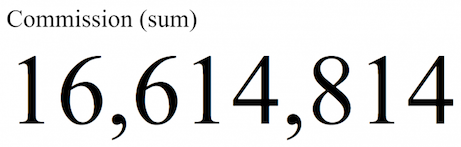
The simplest KPI can be obtained using the following code:
1 2 3 4 5 6 7 | |
The previous code will render the following KPI visualization:
A more advanced example is shown below:
1 2 3 4 5 6 7 8 9 10 11 12 13 14 15 16 17 18 19 20 21 22 23 24 | |
The previous code will render the following KPI visualization:
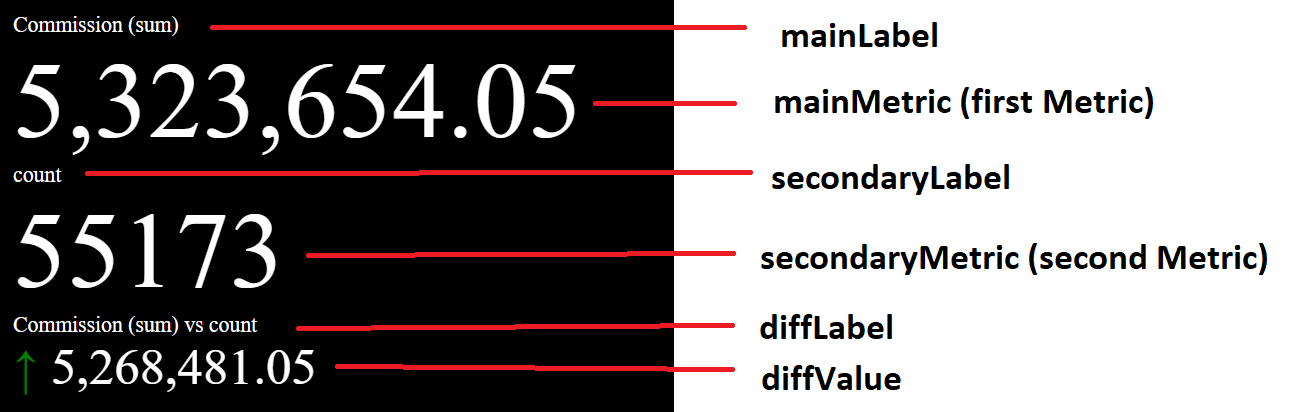
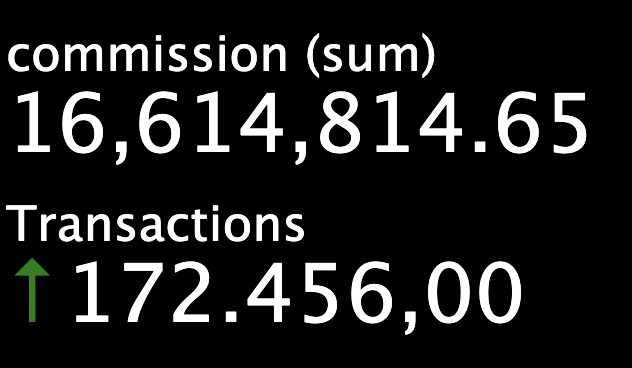
The diff area shows the difference between the first metric and the second metric with the respective arrow indicator. We can hide this diff area with the diff option. When it is set to false, the second metric will show the arrow indicator instead as shown below:
1 2 3 4 | |
KPI Colors
You can configure custom colors for the background, primary value, comparison value, labels, up arrow, and down arrow using the theme object as shown in the example below:
1 2 3 4 5 6 7 8 9 10 11 12 13 14 15 16 17 18 19 20 21 22 23 24 | |
Color Range Support
The KPI visualization also supports color ranges. Refer to the Color Range documentation for details on how to configure color for different ranges.
Additional Options
mainTextSize
Configures the font size of the main metric in pixels.
secondaryTextSize
Configures the font size of the secondary metric in pixels.
diffTextSize
Configures the font size of the difference metric in pixels.
labelTextSize
Configures the font size of the metric labels.
mainLabel
Specifies a custom main metric label.
secondaryLabel
Specifies a custom secondary metric label.
diffLabel
Specifies a custom difference metric label.
showLabels
Allows to show or hide all labels on the KPI chart. It is true by default.
spacing
Sets an equal distance between the first metric, the second metric, and their difference. The unit of measurement is pixels.
labelsTop
Sets the top padding of the labels inside the visualization area. The unit of measurement is pixels.
labelsLeft
Sets the left padding of the labels inside the visualization area. The unit of measurement is pixels.
valuesTop
Sets the top padding of the values inside the visualization area. The unit of measurement is pixels.
valuesLeft
Sets the left padding of the values inside the visualization area. The unit of measurement is pixels.
animationSteps
Specifies the number of steps between the current value and the new value for animation purposes
animationTickDuration
Specifies the duration in milliseconds between every step in the animation
showArrow
Allows to show or hide the arrow on the KPI chart. It is true by default.