Disk
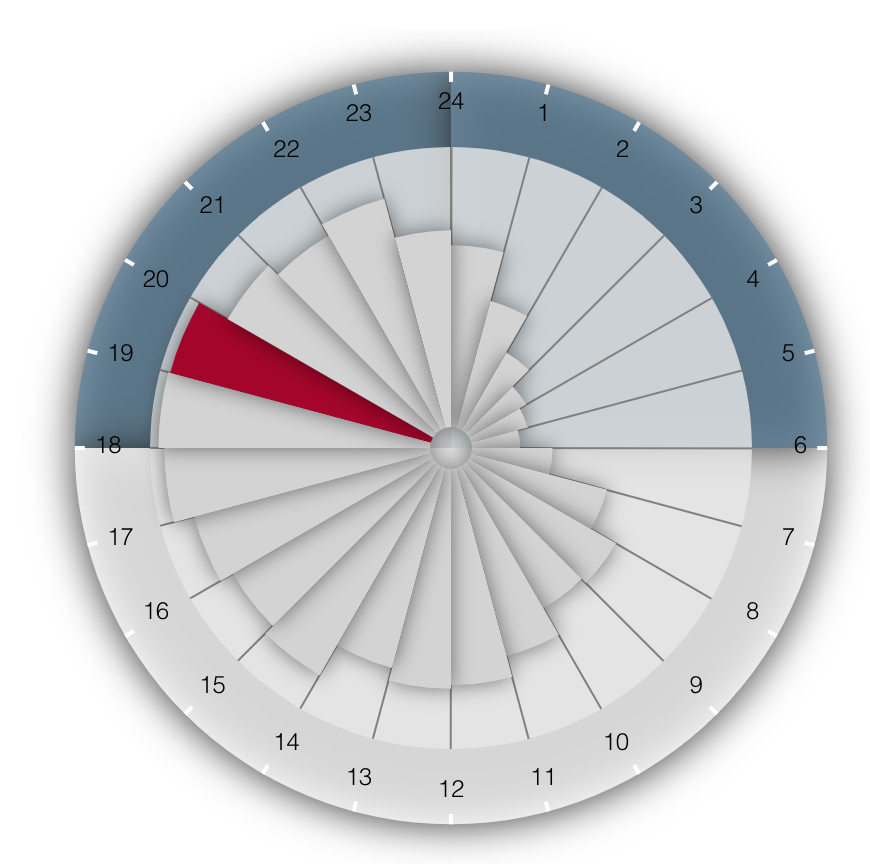
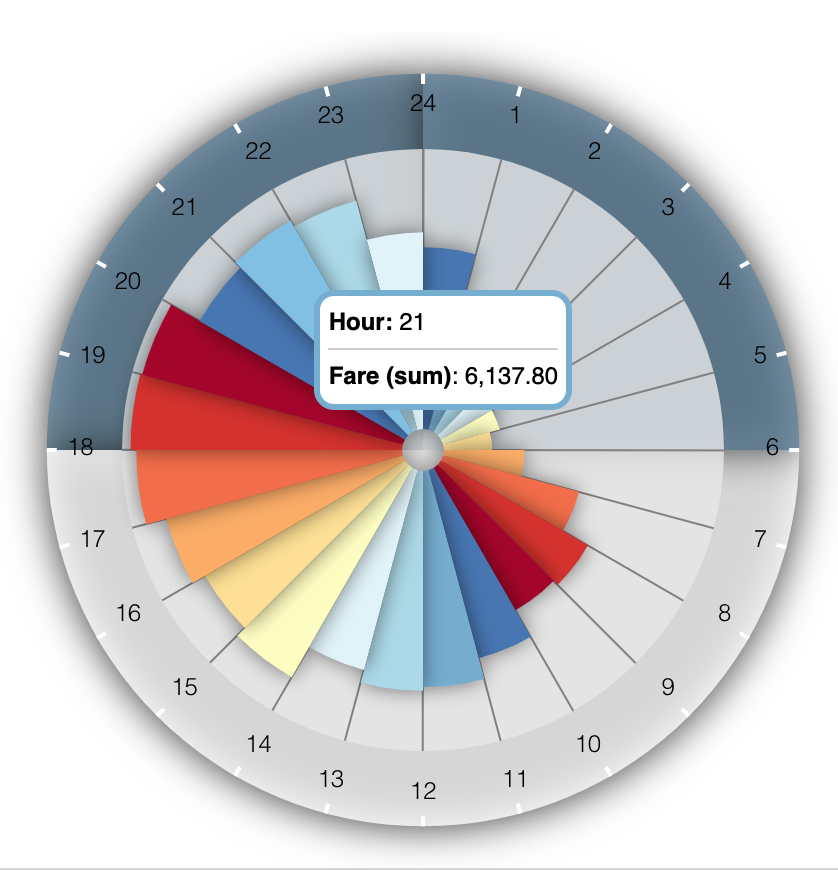
The Disk visualization is designed to visualize metrics across the 24 hours of the day. Hours are rendered from 1 to 24 (or one of the supported formats). The color of the upper half border is darker to represent night and early morning hours.
The disk supports several hour formats, which means that if the data doesn't match with one these formats it will not be recognized as a valid hour data so it will notify the user about it. The supported formats examples are:
1 2 3 4 5 6 7 8 | |
Rendering the Disk
1 2 3 4 5 6 7 8 9 10 11 12 | |
When defining the group that represents the hour field, make sure that the limit used is 24. Otherwise the Disk will not render.
Applying filters
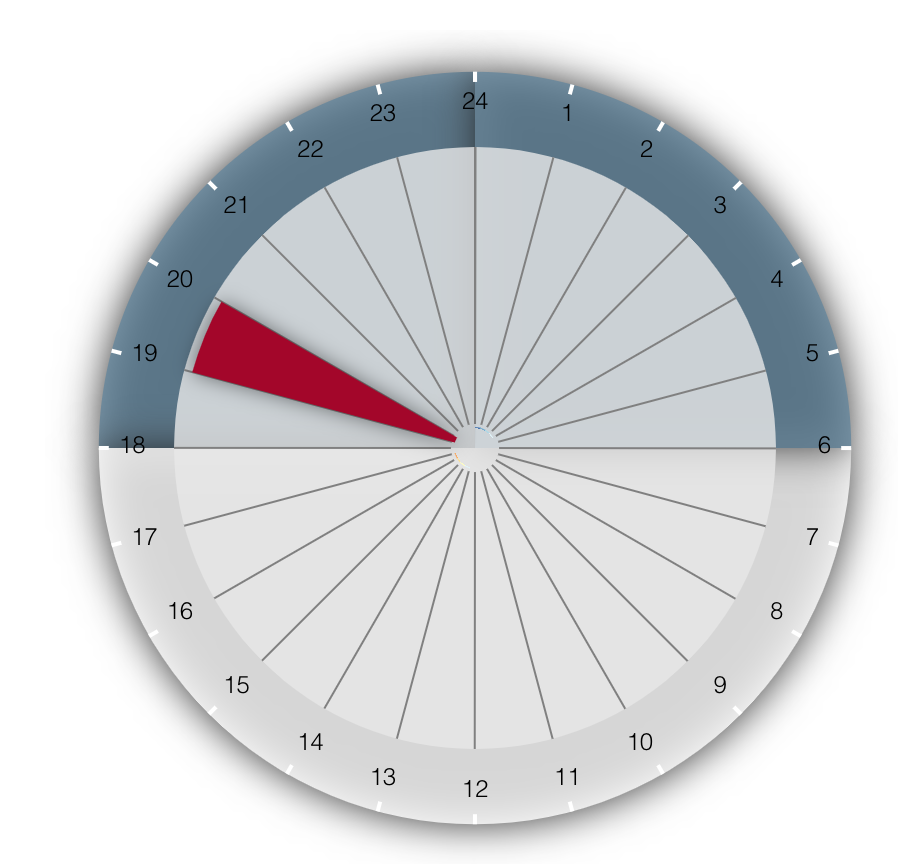
The Disk visualization can be filtered as any other visualization. It will keep only the slice of the selected hour.
However, is highly recommended to use client filter functionality instead as it highlights the selected hour while keeping the other ones in context. It also avoids an extra query. Check the client filters section for more information.