ChartFactor Toolkit Quick Start
The ChartFactor Toolkit enables you to quickly add dynamic data visualizations to your web applications. In a few minutes you will have a sample chart visualizing data from a Ticket Sales table residing in our Elasticsearch server. The Ticket Sales table is derived from the Amazon's Sample Database for Redshift. The data represents ticket sales activity for the fictional TICKIT web site, where users buy and sell tickets online for different types of events.
Create a Chart in 3 steps
Step 1: Install the ChartFactor library
Please follow the Installation guide to setup the ChartFactor libraries in your web application.
Step 2: Add additional script references to your HTML file
In this example we will use jQuery so now it is a good time to add its reference to your HTML page. Also, add a script reference to the mychart.js file. You will create this file in the next step. Please note that for this example, we'll be using the set of standard visualizations and Elasticsearch as the source provider, that's why we include their libraries as well. Your page should look similar to the one below:
1 2 3 4 5 6 7 8 9 10 11 12 13 14 15 16 | |
Step 3: Author the JavaScript file
Create the mychart.js file in the location referenced by the HTML file above. The content of this file is the following:
1 2 3 4 5 6 7 8 9 10 11 12 13 14 15 16 17 18 19 20 21 22 23 24 25 26 27 28 29 30 31 32 33 34 35 36 37 38 | |
There are several things going on in the code above. Let's go walk thru them.
Define data providers
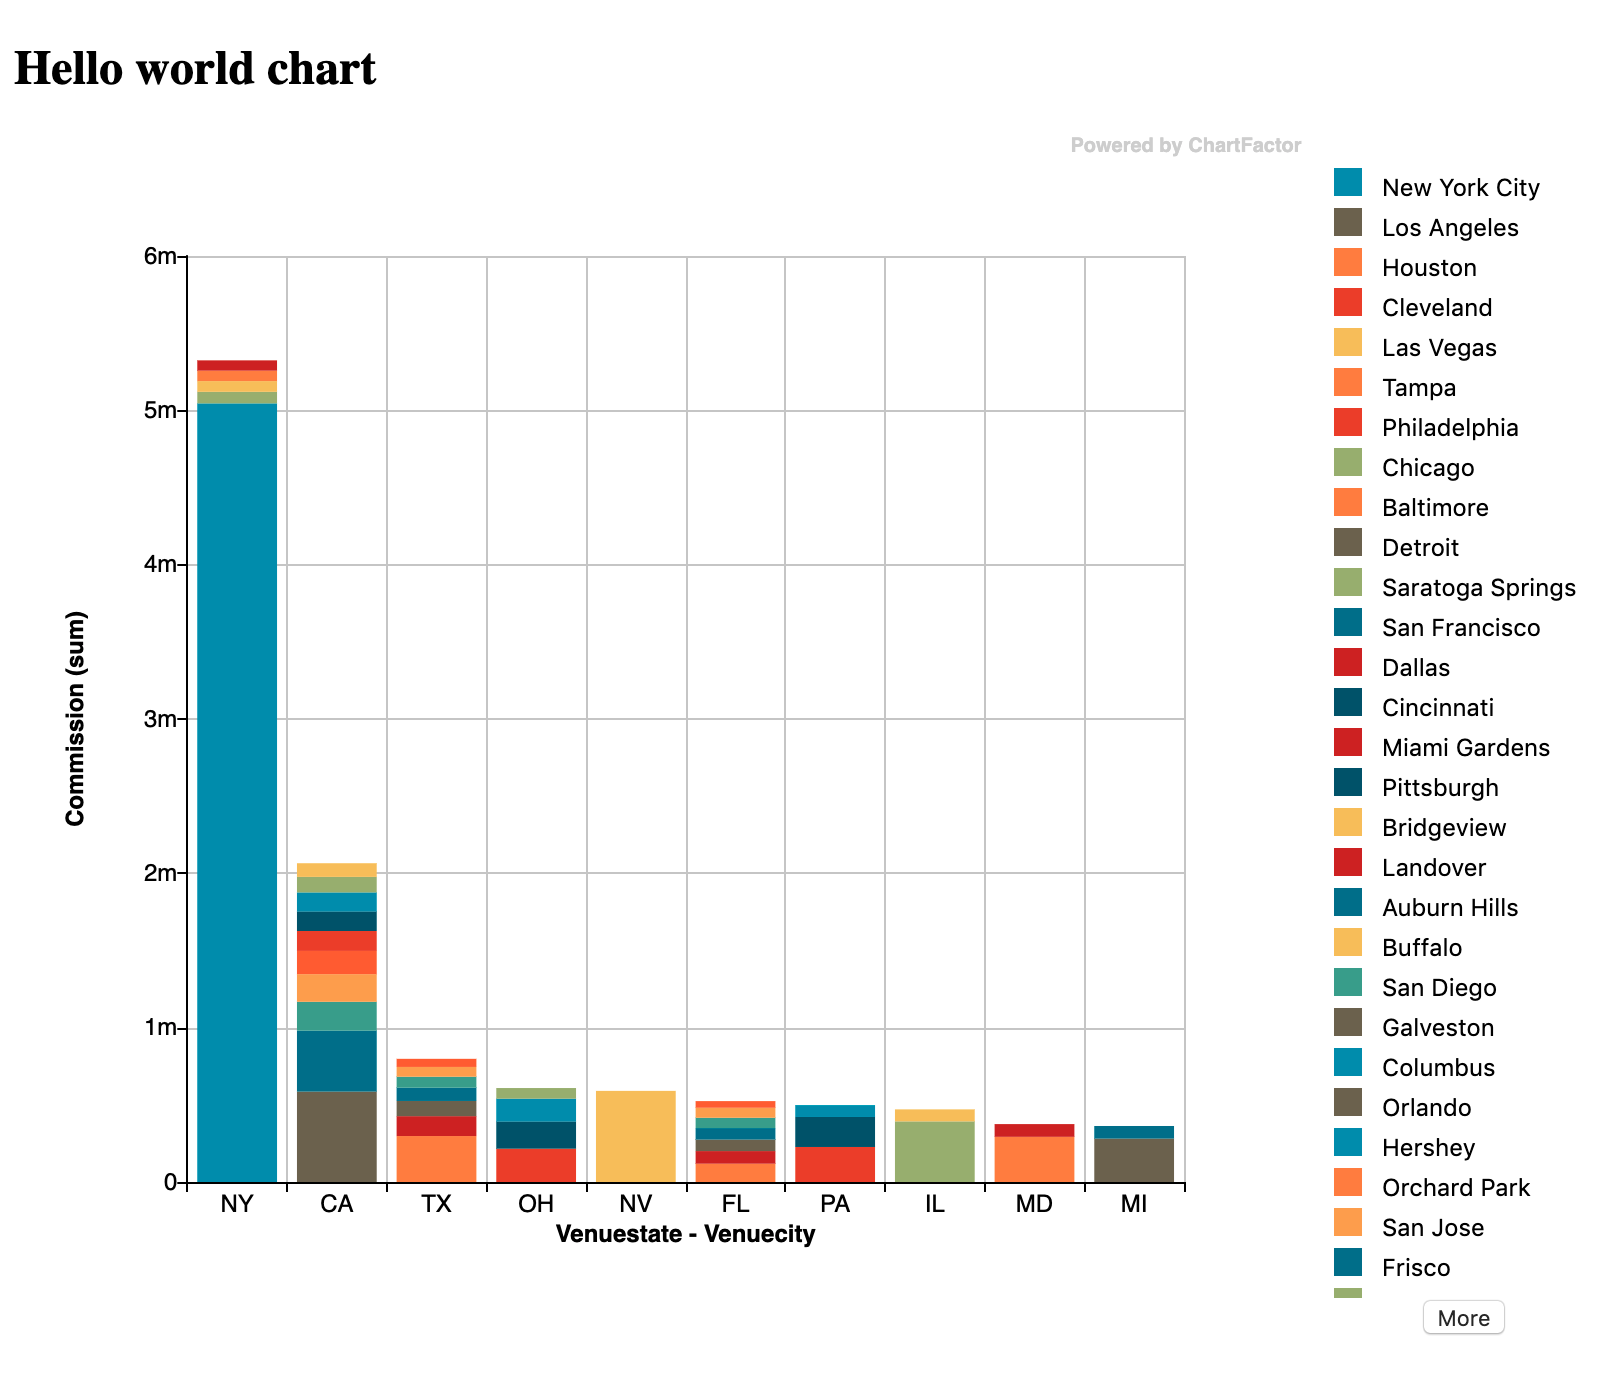
Line 4 defines the data providers that we will use in this example. In this case, we will use one data provider, Elasticsearch, available at the specified URL. Then, line 11 is informing ChartFactor of this data provider definition.
Define the metrics to aggregate
Line 14 creates a metric object using the cf.Metric() function. In this case, we want to sum commission values. Then, we place this metric object in our metrics array (line 15) to be used later on.
Define the attributes to group by
Lines 18 and 21 create attribute objects using the cf.Attribute() function. The attribute definitions also need a limit value and a sort. Line 18 is basically saying: group the venuestate attribute and bring the top 10 based on the sum of their commission values. Then, we place the attribute objects in our groups array (line 24) to be used later on.
Define the chart
Starting from line 27 is where the chart definition begins and puts everything together. In summary it says: Create a new chart using the 'Elastic' provider and the ticket_sales table to group by the attributes defined in my groups array and aggregate the metrics defined in my metrics array. Then render all this using a Bars chart and append it into the "chart" HTML element, and render the legends in the right side of the visualization.
Execute
Finally, it is time to execute my visualization "program". This is done on line 36 with the execute() function.
Step 4: Test your chart
Open your HTML file using your browser of choice, so long as it is not Internet Explorer. You should see a visualization like the one below.