Metric Marker
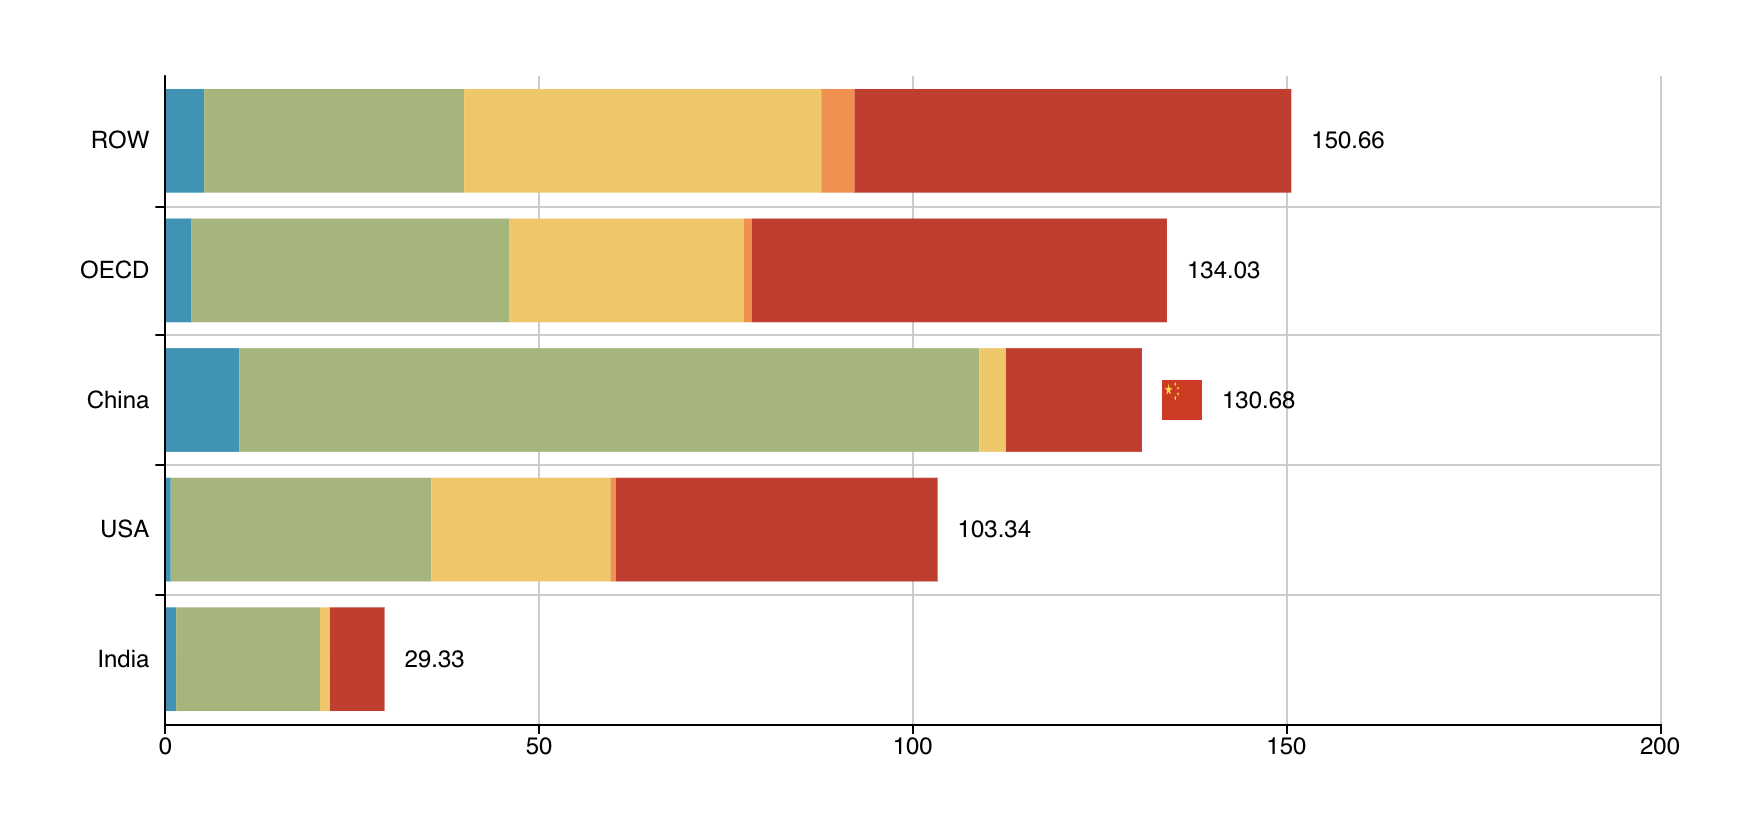
A metric marker is an advanced feature that allows users to set a mark pointer at the top of Bars charts, horizontal or vertical. See example below:
 1
 2
 3
 4
 5
 6
 7
 8
 9
10
11
12 | myChart.set("metricMarker", {
show: true,
icon: [
{
name: 'China',
icon: 'image://data:image/png;base64,iVBORw0KGgoAAAANSUhEUgAAARMAAAC3CAMAAAAGjUrGAAAAyVBMVEXeKBD/3QD/4gDgKA7zvw3dCw3/3wDgJxHeKBLdKRL/4QDfKQ7/3ATeKBTcKg7gJxP/5wndCRX30w/dZRP+7AnkJRD64wTgFg3gHBXTdBDiVBXdShT78BPcLxfhgB/WJBX53hTlpRDsnRLWNhXtwg3xygzXPRLaCRriBQzaWBH42A7mkRvcORHvqRXXTA7kihHrsgzieBTtlhHdbBbcXxvhXw3jhBP04xPtyBjqohLifA7usAveihXWaxLTEhbfXRDPPw3qjCTnoiVFXwtRAAAHV0lEQVR4nO3ca1vbOBYAYFuOpFiKLMmRbQ0hjckNMGkuQ0tJs0N39///qJWTMoWBAYeBDTbn7Yc+rZM89rEu58hKPA8AAAAA4GORhz6B9ybwbBAc+iTeF962vx1BQylxyrNIhkFEae84gpiUItr/NLBUcDnLlYa+U4qC7CQdjrSwsfI1PfTpvAsR90Semta8hVCMk0Ofznthu8pnxidorIXnQVMpSdxCrEMIm0xPMy869Om8JUorjphC9lO/0/F9pMbdM9vmb3teh0SnFW95YM+Zv0WQKS5mDU5n7edutYuz82+MEBcSpVC8WUy99huf2eGcFsOs/fyIGch+jghixFebLyOLqWxu35HnpnAX+NzLgkjExhTLcZqqedbwnM0Omek930wie7JZTbUeKV/NAvF/OLGD4QGOmfrdPjvMhpG1IhDUXhgStRs9EfNoaogf68pvoLrIqdfcocThdqj8jplW7wzZZYybnJq4LoEnbnZFv+M93jHM7vyTho0bb+XUFTCETKrHhCd35yjKmzfc4ottTFSFmecWvTvARj3auKDoCXKpekctsjCs9g55L3u18SgLXMHEvSSr+AHvHe2ZbQnDXOd50f3GrXzkikMpdfdLQxZV7EKVMemwdJq86DbjE1X0E4t/XBeDRpSEIsGTlGwLXbWwL/oIe+XqwcHXsTKr7PlX10A7GKFtoes6z3btbH/2UhGWG0YmOmrEyht3XcffxYSY2YsuCU+ZG6IJOu5mQd0SORkFlNLgvuR0jHYh8X11ld0/6F7Oy4d+fysIpbSXLuUjfgeNdZTUbTxpBzTDD4SG3MaEjU8fHqdPriFkehUblpef4LpOEtatnYScnoxbfzW5jYi7KvbgaGuyeiokcvXtWDGynctTdG1l/cYTOlgfE0XQXcz/FZN7RxhCCqWr7KkJms+ml8PlJCduPGHMjAeC8rqFheJu6qKwber+7q9fzcS/87/lgZSY8UyHTy3p0ySxFp8tXJzjGBkzxvVbapKB7Y9Nx6+gvO8XmovkqYUSTmlEA9s1TI307Oj7Zmh5DVetE/0vw5hPno6IC1uazysuMyU9ZU6wR6XF1Wvr94TSs/MCPRMSl+mrJa+YlbaDMFdR3Wace2iU2I16JihMfcdVn2cFAhdrXLeh9S+40CuD0ifGEhNPceUbTyPcimr/7Djh2WyiHh1qy5SUmLVOguopaZv2bO0XTgJPUDs05JEOVCbp5A9MpajcGbjkgsu6t5Mt3P2GHkaFdEyr34yS/wVoFrUYexCT9MINl82o+ffHQ5drPZxwOjeuFv6gIfEo15sHeQohqvv8Q9LmSkT+oO8QH23wx40JF18VeSQmRXv/ebVNG9Lb7Gf0SILCVJfunacHgjeicQkvfyQkLiabFxRyNqzdGsFj7I9f2T1htwUQISS/4fv2nuyq7vXODj5Rt2FgZrFRfy4fmK7cd+seLn4kta94HF2wXUTStJhj/Mmknd0oq050tF9M6Ex9xrWPSVTu6yuf/3VcRrIR1pN2HpdNxWX7pMB79B3u/tiVyT0ZSU7pCyat9yLy8FqxMibMrHZjgR2cGNZxszMxR/sMmEEisk3qUj1XNUrqysE3OuU3JwJabFei1WRmZbkKzYNA/5GX3Ymota268YhajC0+zZHf0tjKaDarbw9qJ3Oz7TdD7dKt8jrKYj+bthTpEL8Q1RZPQvplPVx/XrZci2NxUeTmul/f+SfEQ+VG17yLg7sXIfVQIZ+ZXrV2wkW4OFYIoe2zj22Ekwrbsd8rGxPftEIr7n//k56d56mv1tXSNun6zqhl2O6REFOXmAb13Q9Jj1SaLnQS0fuJPA/tYGlYgT1aZQKRXASnV2lZShI0+Xcm2jX+UgIemrinH7ulXOLvqZrLpPL+Tv3bdhlmu5m0to3E0fly8PhuESo57hXrrPrecbwhKUPEpTW8ziGhvU9aho8+xnTjgbD4P4OKzzhdQqLdCJS3TG6+2trttbiLPrlrk3tZICr2HSmPjJr0bxaGbHRU5+o4eaqZ0ygSVa+OemJ4vL6hNJtNTFTfJLaKqlkGpzZeac/VOW08/GTrO+u8IteiereL2lbWbkPOmwi9UIqfpQD1+gc+mwOKJBXJn02iDV9I98oOg/+b1XmKeQMBviiasQD7j3ExnWlXH4msq8YQk51ExJujm0xEKWrVc+faq+Oi/cOYYjEqUrT8yE+V7ytXcZEiBG3OgiiEDK1EB8X2MRCbzK1t8K8V7CO0X1S5uYkgNbmI4DeVSjTo5+TnBgRzfH0UQPcp+w76GZFi+X3q1XoV6ZXopSKMuTH25EhiKaN6b59+BRHFsFyY18TUi6hLm4i1OV99aVyONc6Qu99+400g0OBfaJn16aVQ3gTln52cczpbmHEJyXxim80Ofw3sj7Kq3x3cUPoh2vyG/1vCqYDx5AEICAAAAAAAAAAAAAAAAAAAAAAAAAAAAAAAAAAAAAAAAAAAAAAAAAAAAAAAAAAAAAAAAAAAAAAAAAAAAAHwg/wNyqXdNCfyBTgAAAABJRU5ErkJggg==',
// margin: 20
},
],
margin: 10,
iconSize: 20 // Same size for all icons on the chart
})
|
The previous code adds metric markers to your bar chart as follow:
Metric Marker Configuration
- show: shows or hides the metric markers. Its default value is
true.
-
icon: inside this option, you can define an array of objects with the following options:
-
name: the exact matching attribute value. This is useful if you need to set an icon image, as you can see in the sample code and picture above for "China".
-
margin: overrides the global distance between the icon and the metric value
-
fontSize: overrides the global font size of the metric value
-
fontColor: overrides the global font color of the metric value
-
iconSize: overrides the global size of the generated icon. It can be a number or an array to represent [width, height].
-
iconOffset: overrides the global offset of the generated icon. Support an array representing the [x, y] coordinates.
-
labelOffset: overrides the global offset of the metric value. Support an array representing the [x, y] coordinates.
-
icon: defines a specific icon associated with attribute value. Default predefined icons are: 'circle', 'rect', 'roundRect', 'triangle', 'diamond', 'pin' and 'arrow'. Also, you can use a URL, a Base64 code image, or an SVG. To use ULR and Base64 you need to precede your code with image://(image). In the case of SVG you need to precede your code with path://(SVG).
-
margin: defines the global distance between icons and metric values
-
iconSize: defines the global icon size. It can be a number or an array to represent [width, height].
-
fontSize: defines the global font size for the metric value of all markers
-
fontColor: defines the global font color for the metric value of all markers
-
position: defines the position of the metric value with respect to the generated icon. Default for vertical charts is top and for horizontal chart is right. The available values are: 'top', 'bottom', 'right' and 'left'.
-
format: defines the format for the metric value of all markers. The default value is standard. The availables values are: standard and bignumber.
-
labelRotate: defines the rotation of the metric value of all markers. The default value depends on the orientation of the chart. The default value for vertical charts is 0 and for horizontal charts is 90.
-
iconOffset: defines the exact offset to start to render the icon of all markers. Support an array representing the [x, y] coordinates.
-
labelOffset: defines the exact offset to start to render the metric value of all markers. Support an array representing the [x, y] coordinates.