ChartFactor Studio Introduction
ChartFactor Studio is a client-side environment to enable the visual interaction and analysis of data. By client-side we mean that your information lives only on your browser and not sent to any server. ChartFactor Studio is infinitely scalable to any number of users and to any amount of data, only limited by the performance of your data engine. ChartFactor Studio connects directly to your data engine, pushing down aggregations and bringing to the browser only the information that users need to see based on their navigation.
ChartFactor Studio is similar to other visual analytics environments in that it allows users to easily configure their visualizations and interact with their data to discover insights. The main difference is that it also allows users to see the code that powers its analytics functionality at all times, no matter if users are changing visualization settings, adding filters across visualizations and sources, drilling in or drilling through visuals. We call this feature code-transparency. By being code-transparent, Studio empowers its users to create their own data applications with the same components and functionality they enjoy in ChartFactor Studio.
The picture below shows ChartFactor Studio with a quick analysis of Austin 311 Calls starting from December 2013 up to July 2019 for specific council district codes.
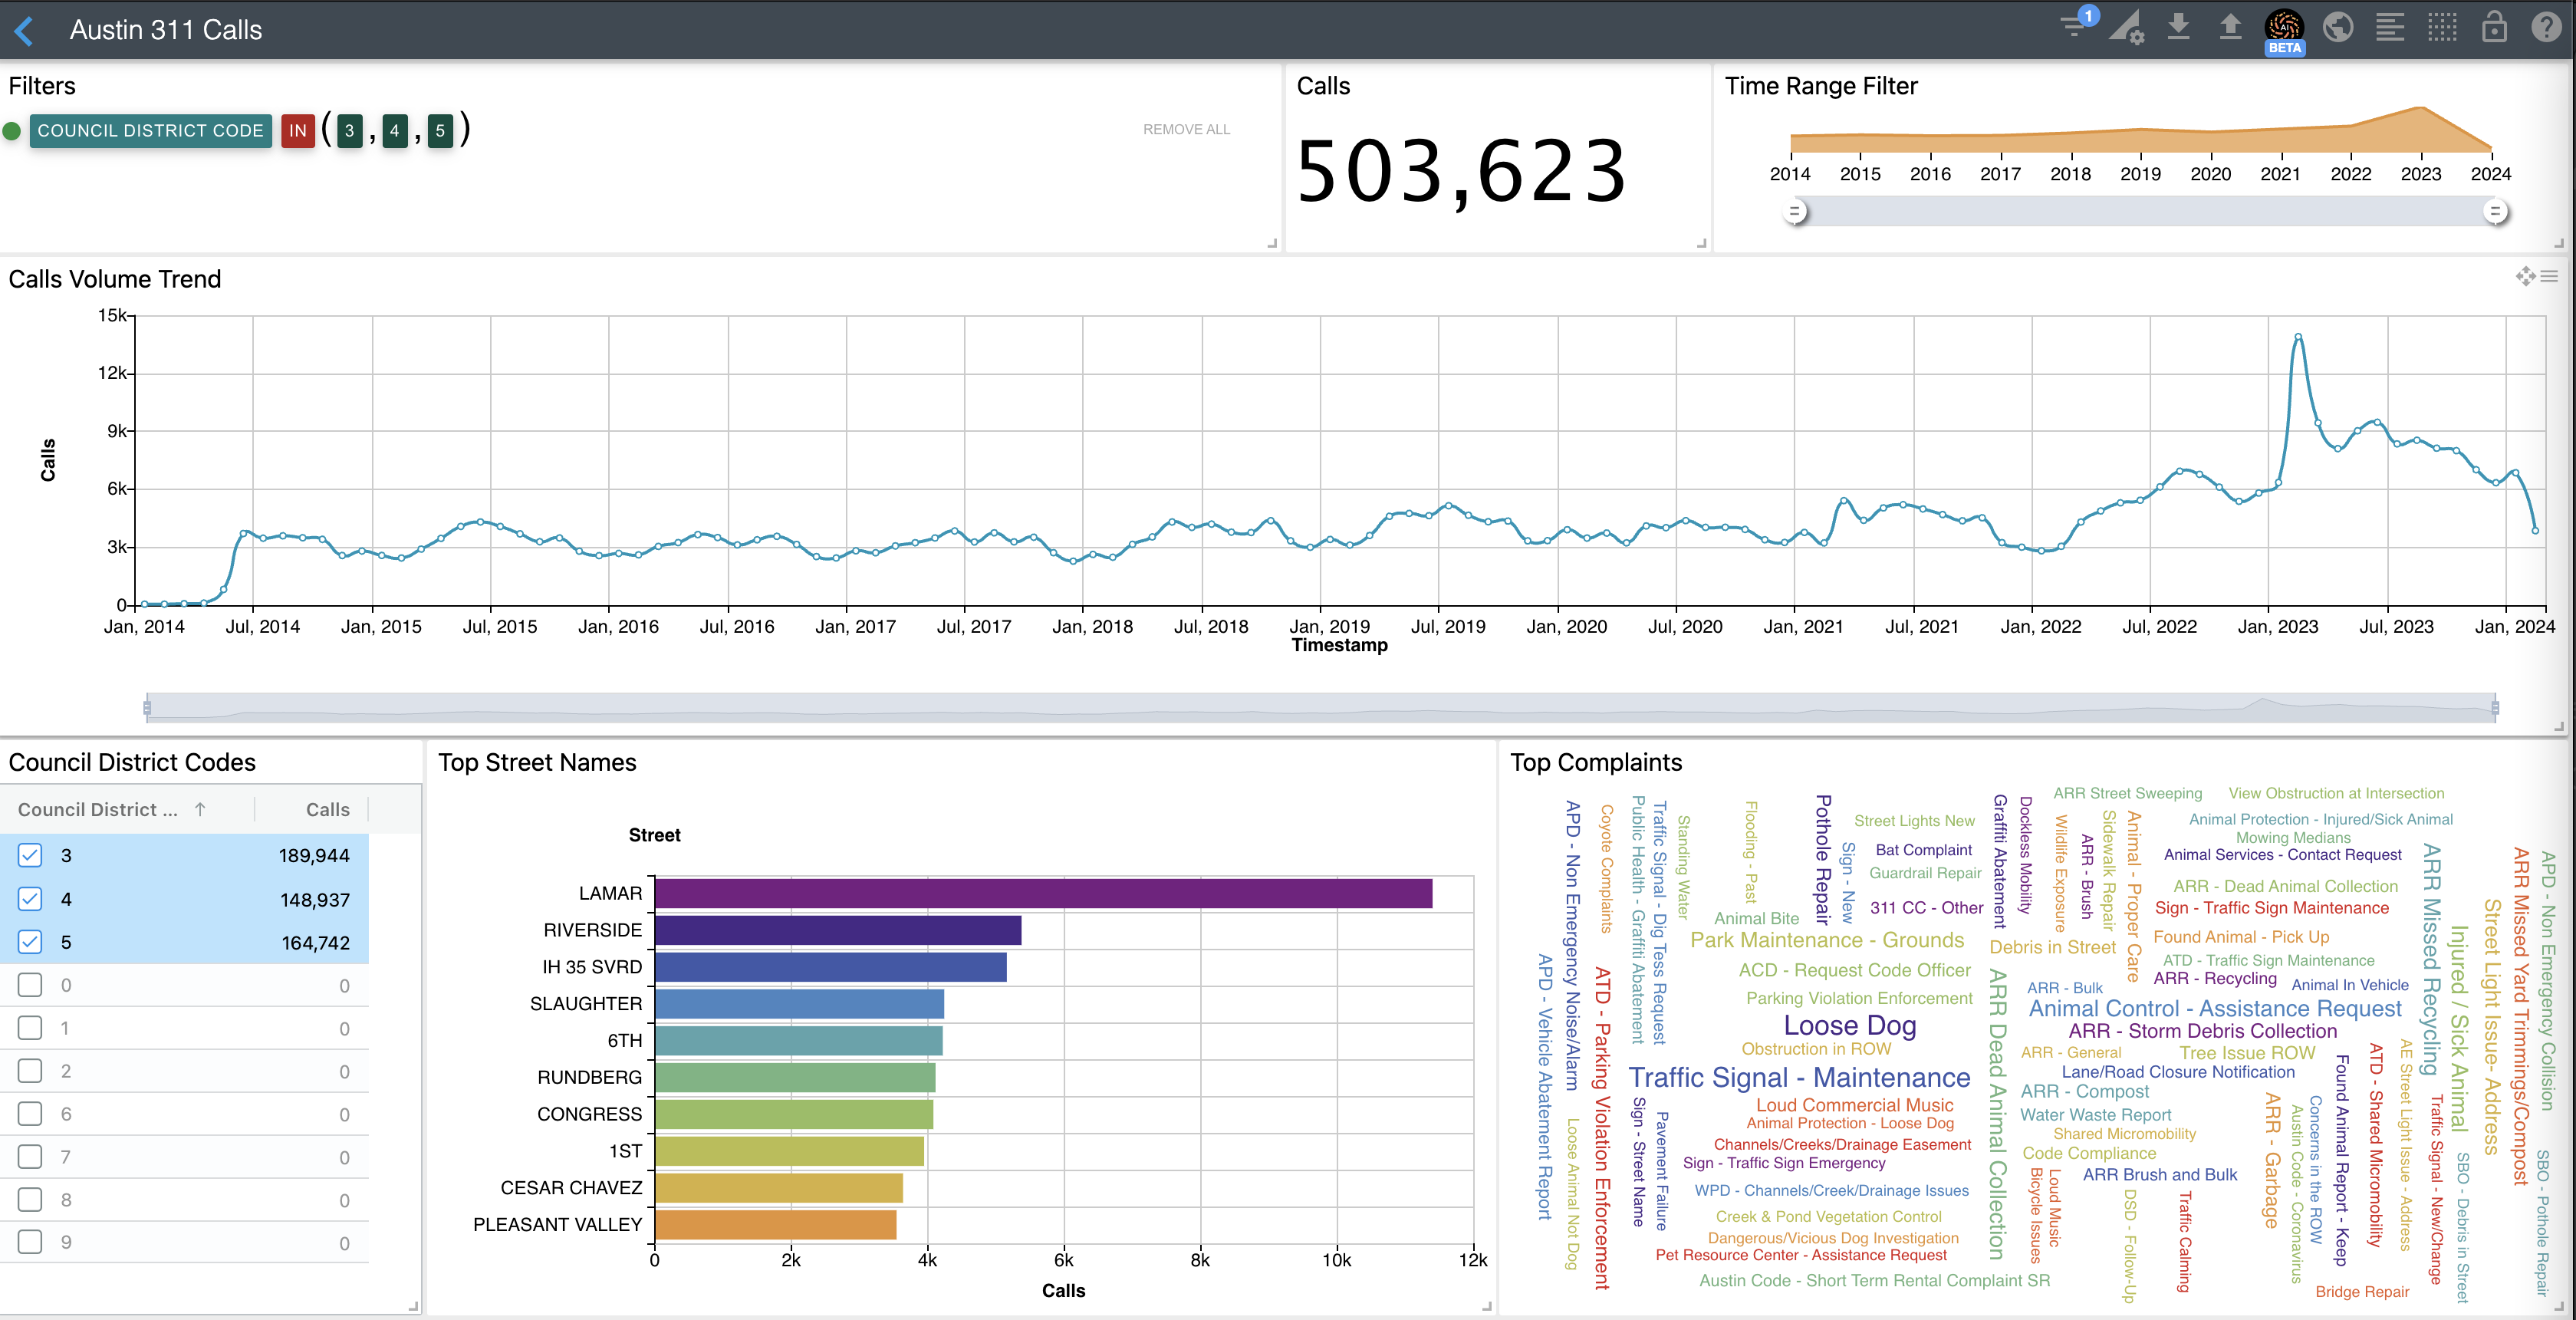
In the following sections, we'll show you how to create this and more advanced dashboards using Studio. But first, let's review some of ChartFactor Studio's characteristics.
Scalable
To cover scalability properly, let's review data scalability, user scalability, and dashboard scalability.
Data scalability
ChartFactor Studio infinitely scales to any amount of data. As mentioned earlier, it is only limited by the scalability of your data engine. ChartFactor Studio pushes down data aggregations and brings to users only the data they need to see based on their navigation.
User scalability
ChartFactor Studio's lightweight architecture supports an unlimited number of users, only limited by the scalability of your data engine.
Dashboard scalability
ChartFactor Studio uses the latest browser techniques to enable users to create very large dashboards with visualizations that can be sliced and drilled down all at the same time. Additionally, when reaching device limits in terms of memory and processing power, ChartFactor Studio can be used in conjunction with Studio CLI to break down large dashboards into multiple tabs and interact with these visualizations across tabs and sources.
Flexible
ChartFactor Studio enables users to create visualizations and dashboards based on their business scenarios. It provides flexibility at the following levels:
Data Sourcing
As soon as users point to their data sources, ChartFactor Studio understands fields, field types, values, value ranges and any other detail to enable users to start visualizing their data right away. No scheduled jobs needed. ChartFactor Studio also allows users to enrich this metadata with business-oriented field labels, field types, currency information, derived fields and anything else to meet the business use case.
Dashboard Authoring
ChartFactor Studio provides users with a rich list of visualizations to create dashboards that meet their specific business needs. In addition, users are able to add interactivity to enable one-click filters, drill-downs, drill-thrus, slicing of data, metric range filters, time window selection, and time playing for historical and real-time data.
Visualization Editing
With ChartFactor Studio, users can configure their visualizations with the right attributes, metrics, titles, color palettes, margins, axis, data zooms, sorts, limits, and any other element needed to convey the information to audiences and to enable them to interact with the visualizations and find insights.
Secured
ChartFactor Studio leverages the native security model of your data platform, avoiding the additional administration complexity and security risks of bringing its own security model.
Extensible
ChartFactor Studio allows users to easily integrate their custom charts developed with the technology of their choice. These charts become part of the ChartFactor ecosystem of interactive visualizations.
Embeddable
Through its transparent code approach, ChartFactor Studio enables its users to see the code of every component in their dashboards. This code can be copy/pasted into users standalone applications to embed their same functionality. Refer to the ChartFactor Toolkit documentation to create your own visual analytics applications.
Historical and Real-time
ChartFactor Studio enables users to replay historical data and play real-time streaming data. Through the use of its Time Slider component, users can easily select different time windows by sliding time handles or by using fast/flexible presets (e.g. Today, Yesterday, Day so far, This month, This year, Last 15 minutes, etc.). Users can also drill-down into smaller and smaller time windows, for example, from a specific day to a specific hour, to a specific minute.
Versionable and Collaborative
Through its Export/Import function, ChartFactor Studio allows users to easily integrate with version control tools such as Git and SVN.
Git diff tools for example render changes through versions at the line level. And through the use of tools like GitHub, groups of users can collaborate with advanced change control. Note that ChartFactor Studio dashboards are a collection of ChartFactor Toolkit components and exported files consist of ChartFactor Toolkit code. For users to access their data, they need to authenticate to their data platform.
In the next sections we'll cover the following topics:
- Connecting to your data
- Visualizing your data
- Adding interactivity
- The data view
- The metadata view
- Updating source metadata
- Duplicating charts
- Security