Legend
Legends are used to display the values of each entry in a visualization. They are not enabled by default.
1 | |
The value passed to the option can be a string with values of 'none' to hide it or 'right', 'left', 'top' or 'bottom' to display the legend in the respective position.
The option also accepts a cf.Legend object with the following format:
1 2 3 4 5 6 | |
The Legend() object may contain any or all the configuration values shown in the code above. position() is required, the rest are optional. width() and height() values are in pixels.
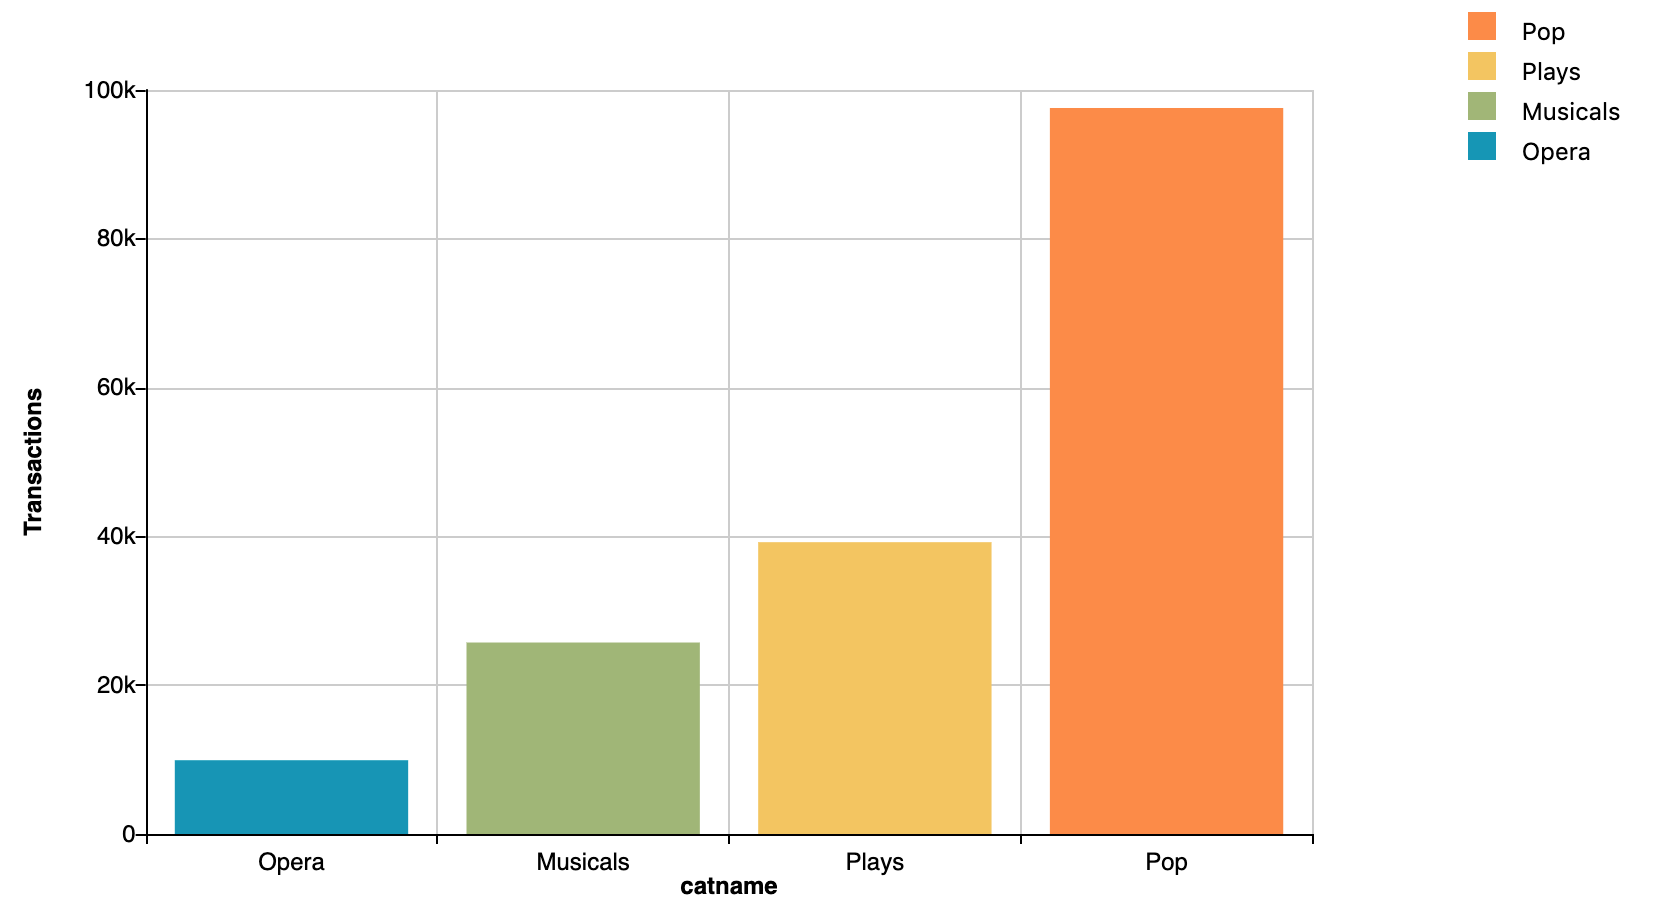
The chart below shows the legend on the right of the chart.
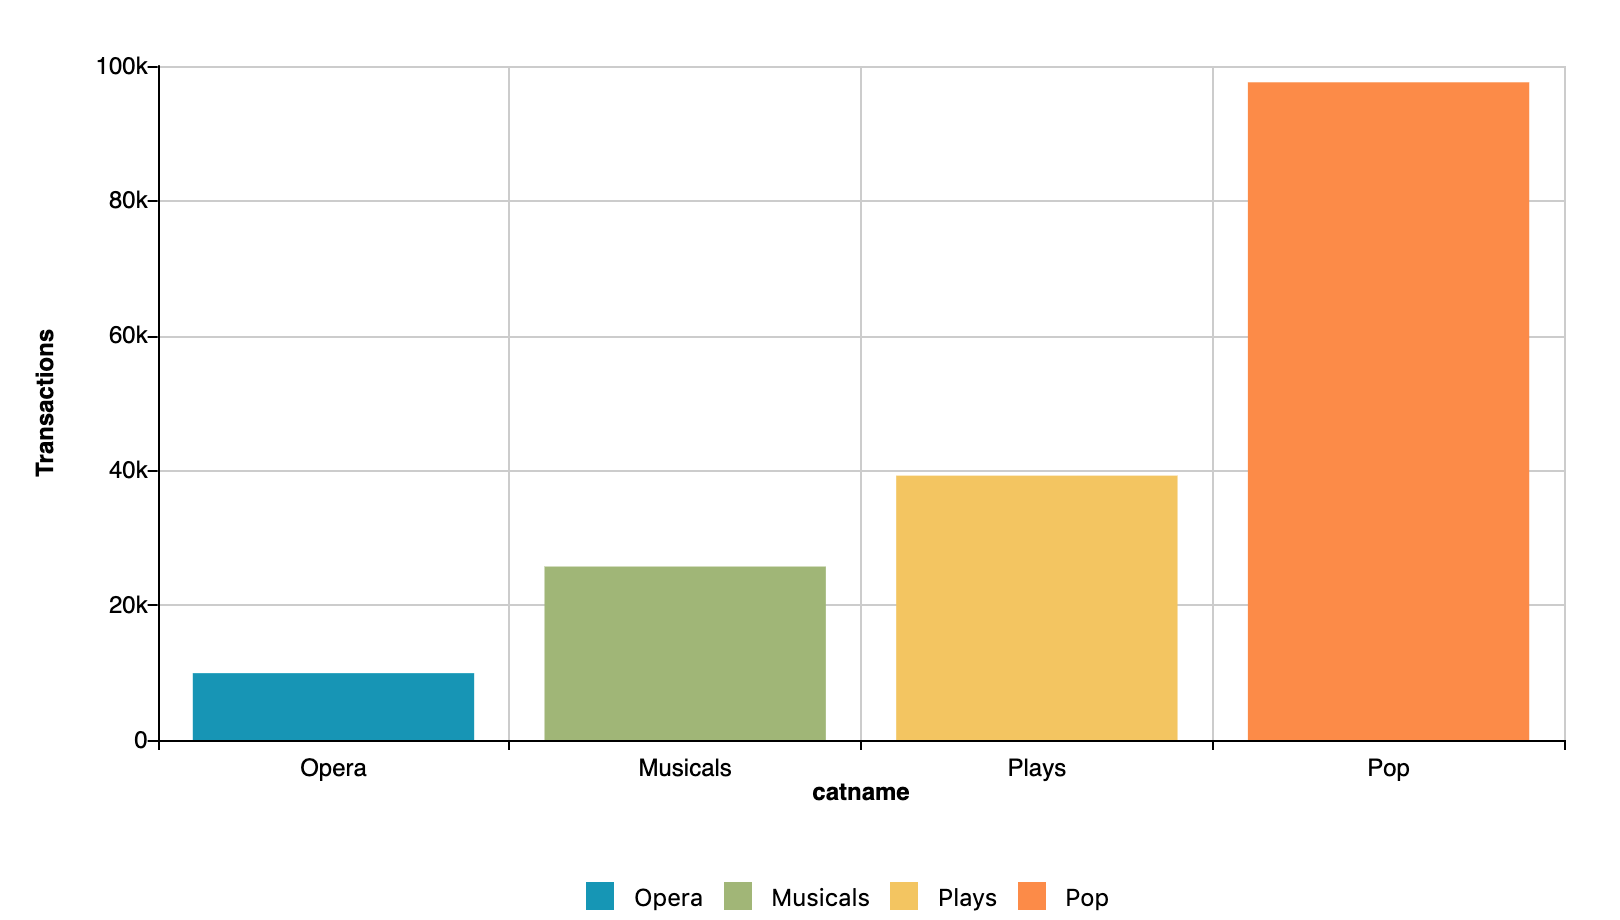
The chart below shows the legend at the bottom of the chart.
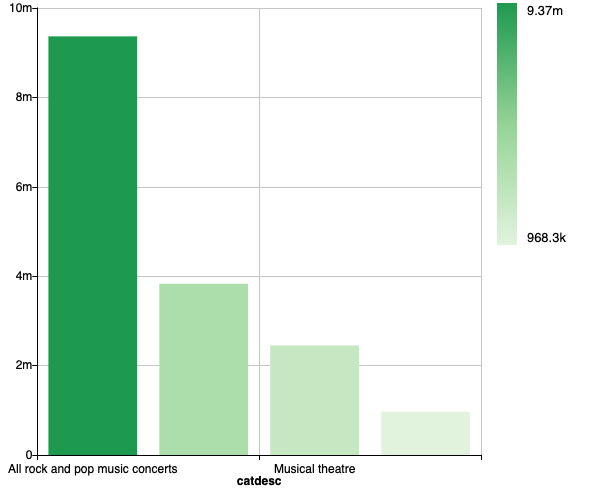
Positions top and bottom are not applicable when the legend represents a gradient range for a given metric:
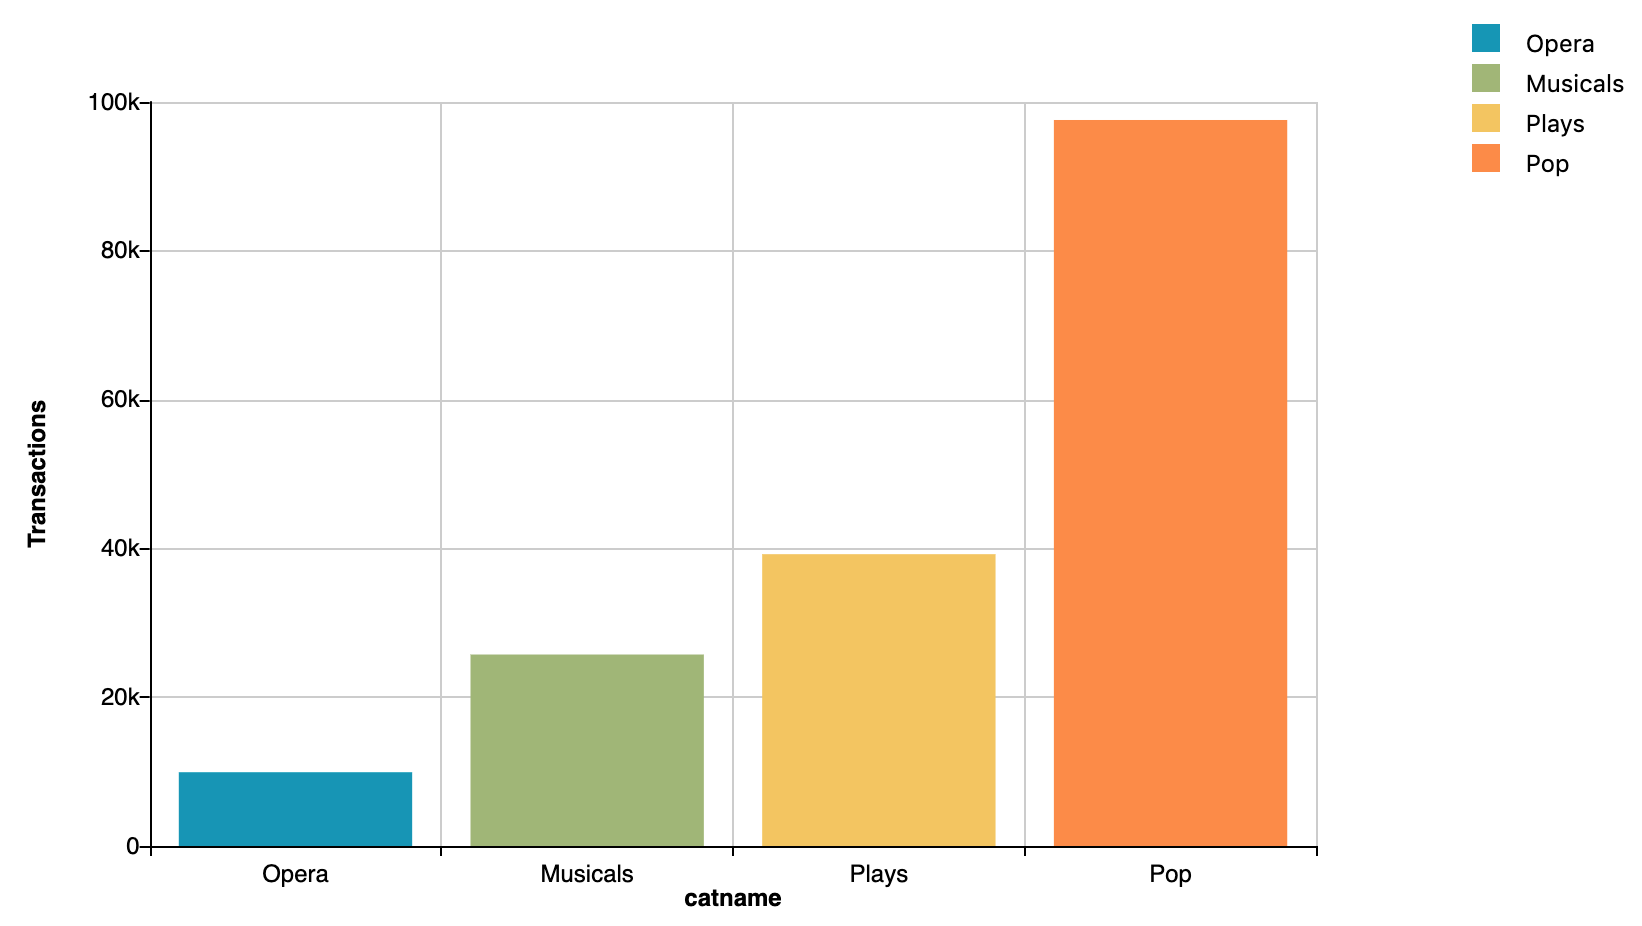
sort() accepts 'none' or 'reverse'. The chart below shows the legend items in reverse order.