Updating source metadata
Using custom metadata, you can define field labels, field types such as MONEY, field currencies, time zones, time fields' granularities, and even derived fields. Refer to the Providers Metadata and Custom Metadata for more details.
Some user actions update custom metadata for the specific source. For example, modifying a column label using the Raw Data Table chart editor. The Visualizing your data section describes how to do that.
Additionally, you can edit this custom metadata manually by using the ChartFactor Studio's Metadata option on the top right corner of the dashboard page. See below:
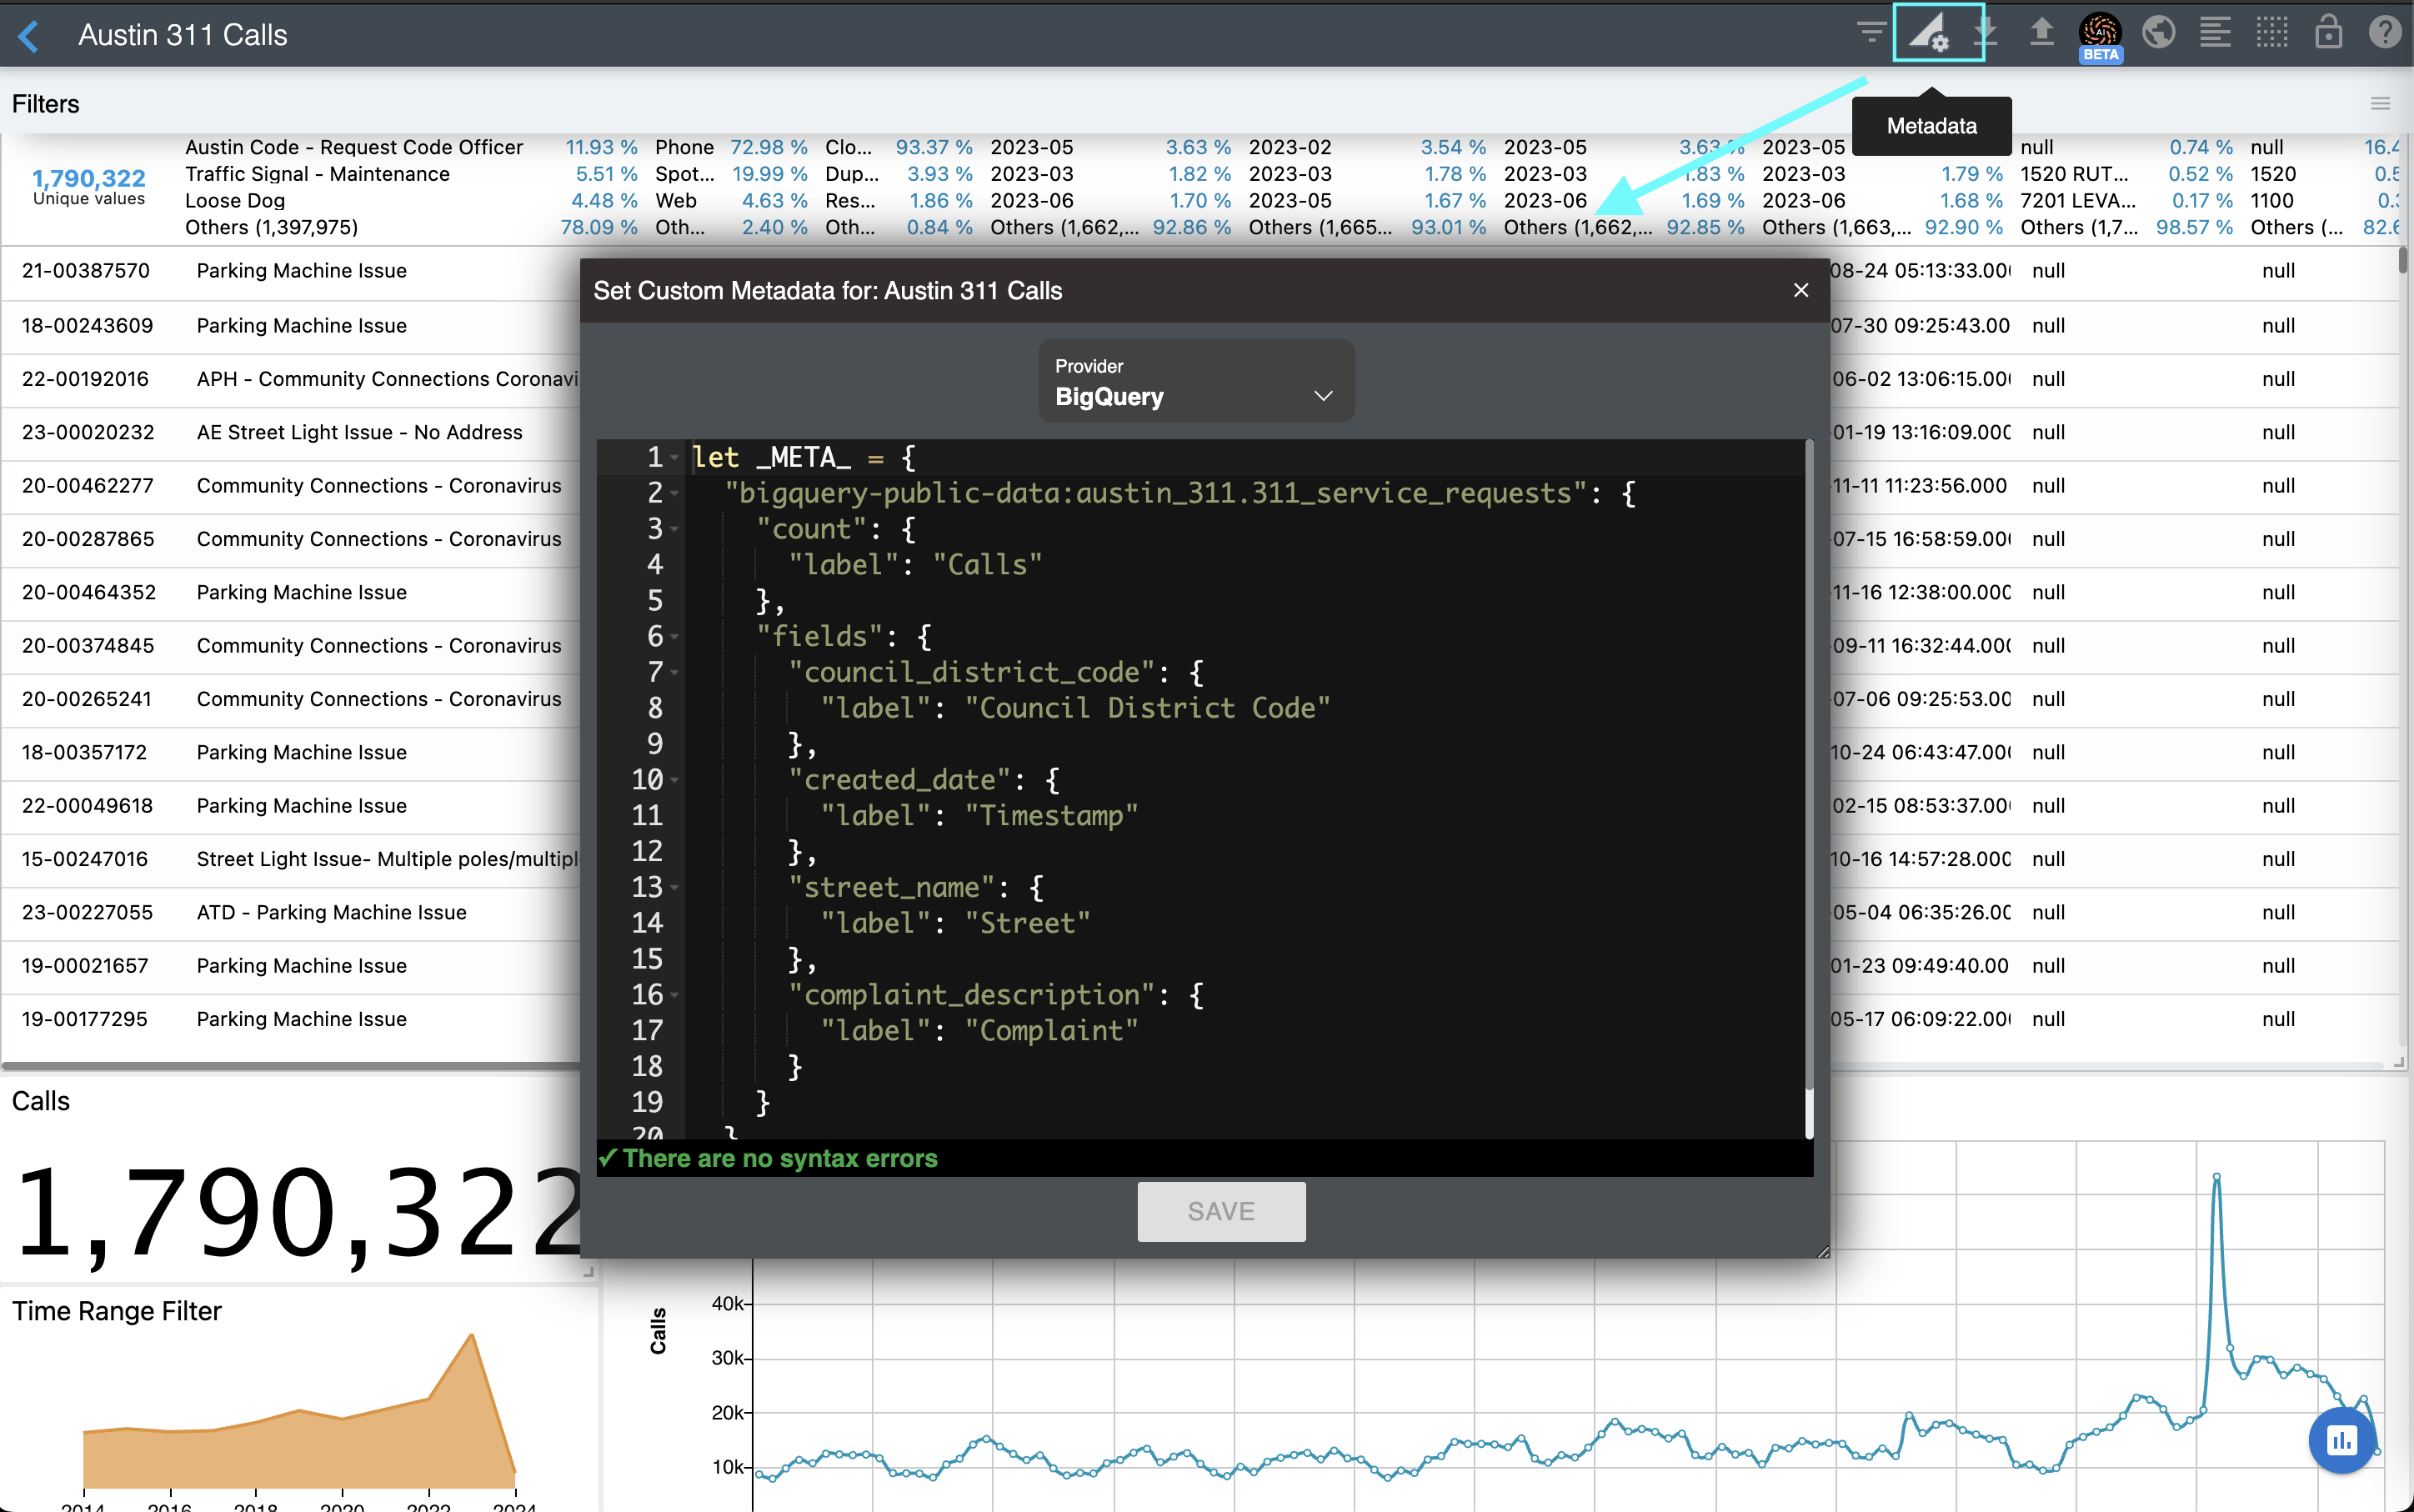
Here you see the _META_ variable. ChartFactor Studio uses this variable to obtain your custom metadata. The first time you use the Metadata option, it may have commented out code with sample definitions to guide you. Also, if you updated labels using the Raw Data Table chart editor, it will include label definitions for the appropriate source.
A sample definition for the Austin 311 Calls dashboard looks like this:
1 2 3 4 5 6 7 8 9 10 11 12 13 14 15 16 17 18 19 20 21 | |
Notice how I relabeld the "Count" metric to "Calls" instead since each record in the source represents a 311 call.
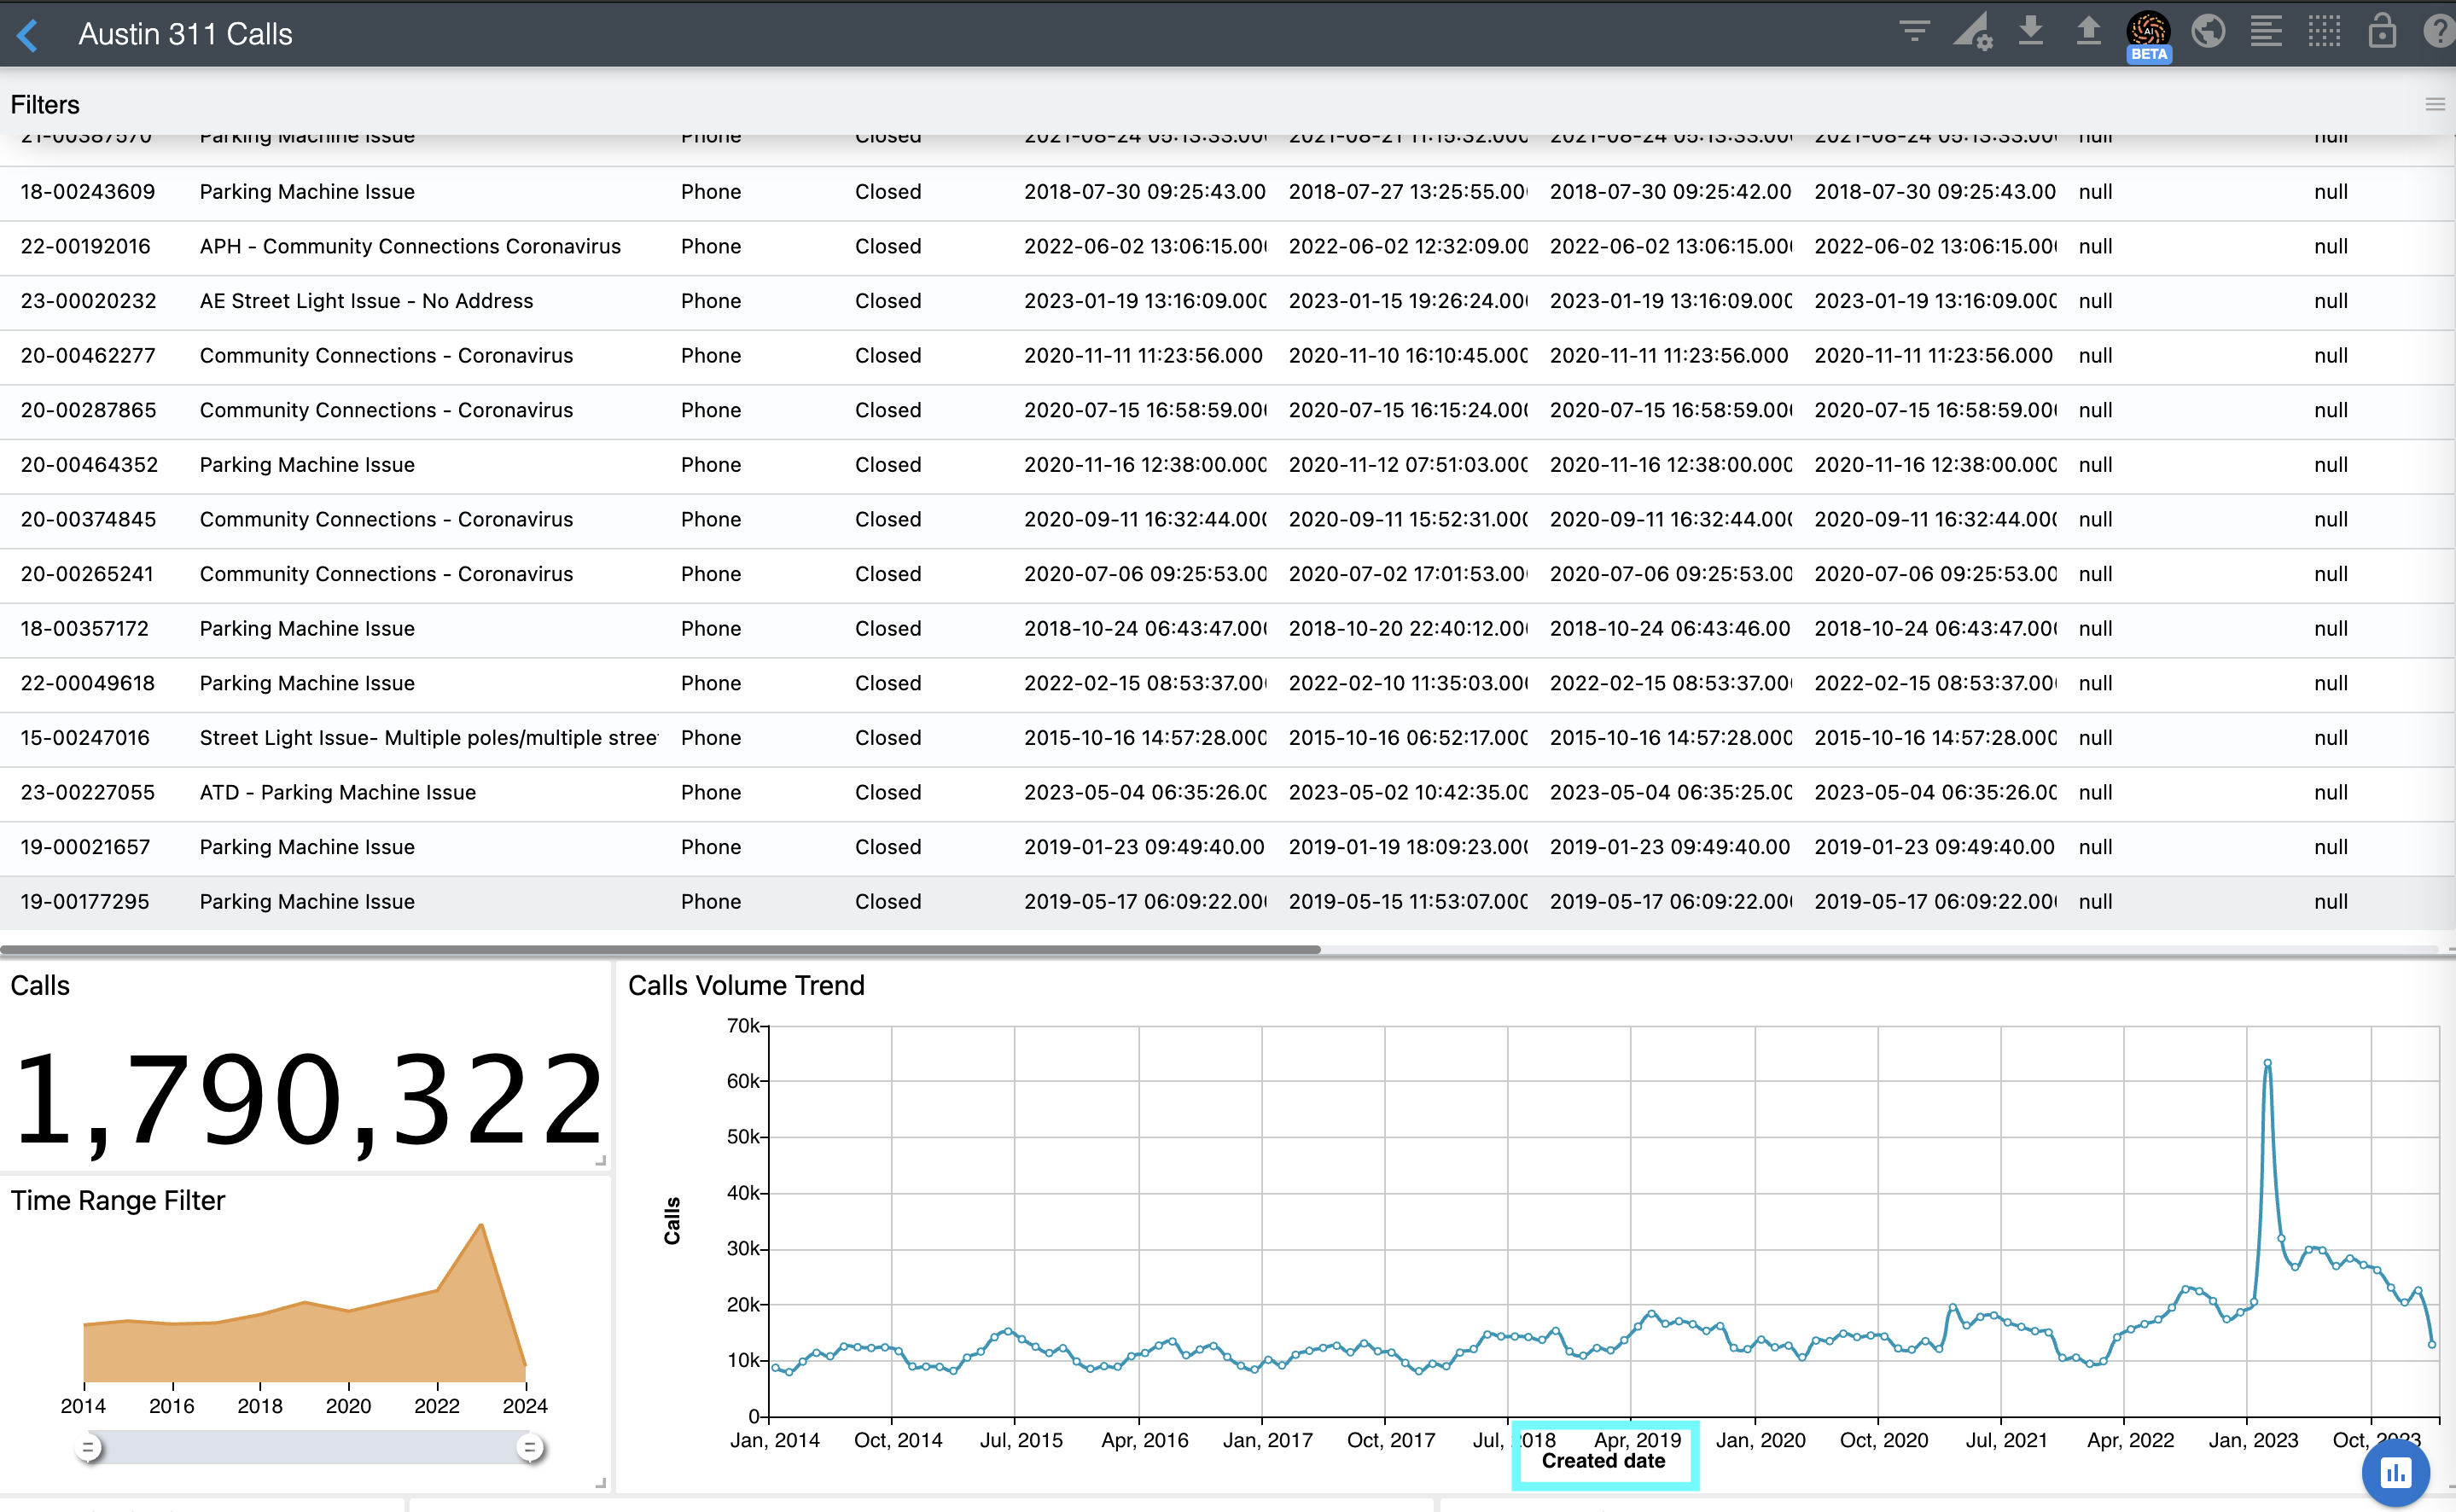
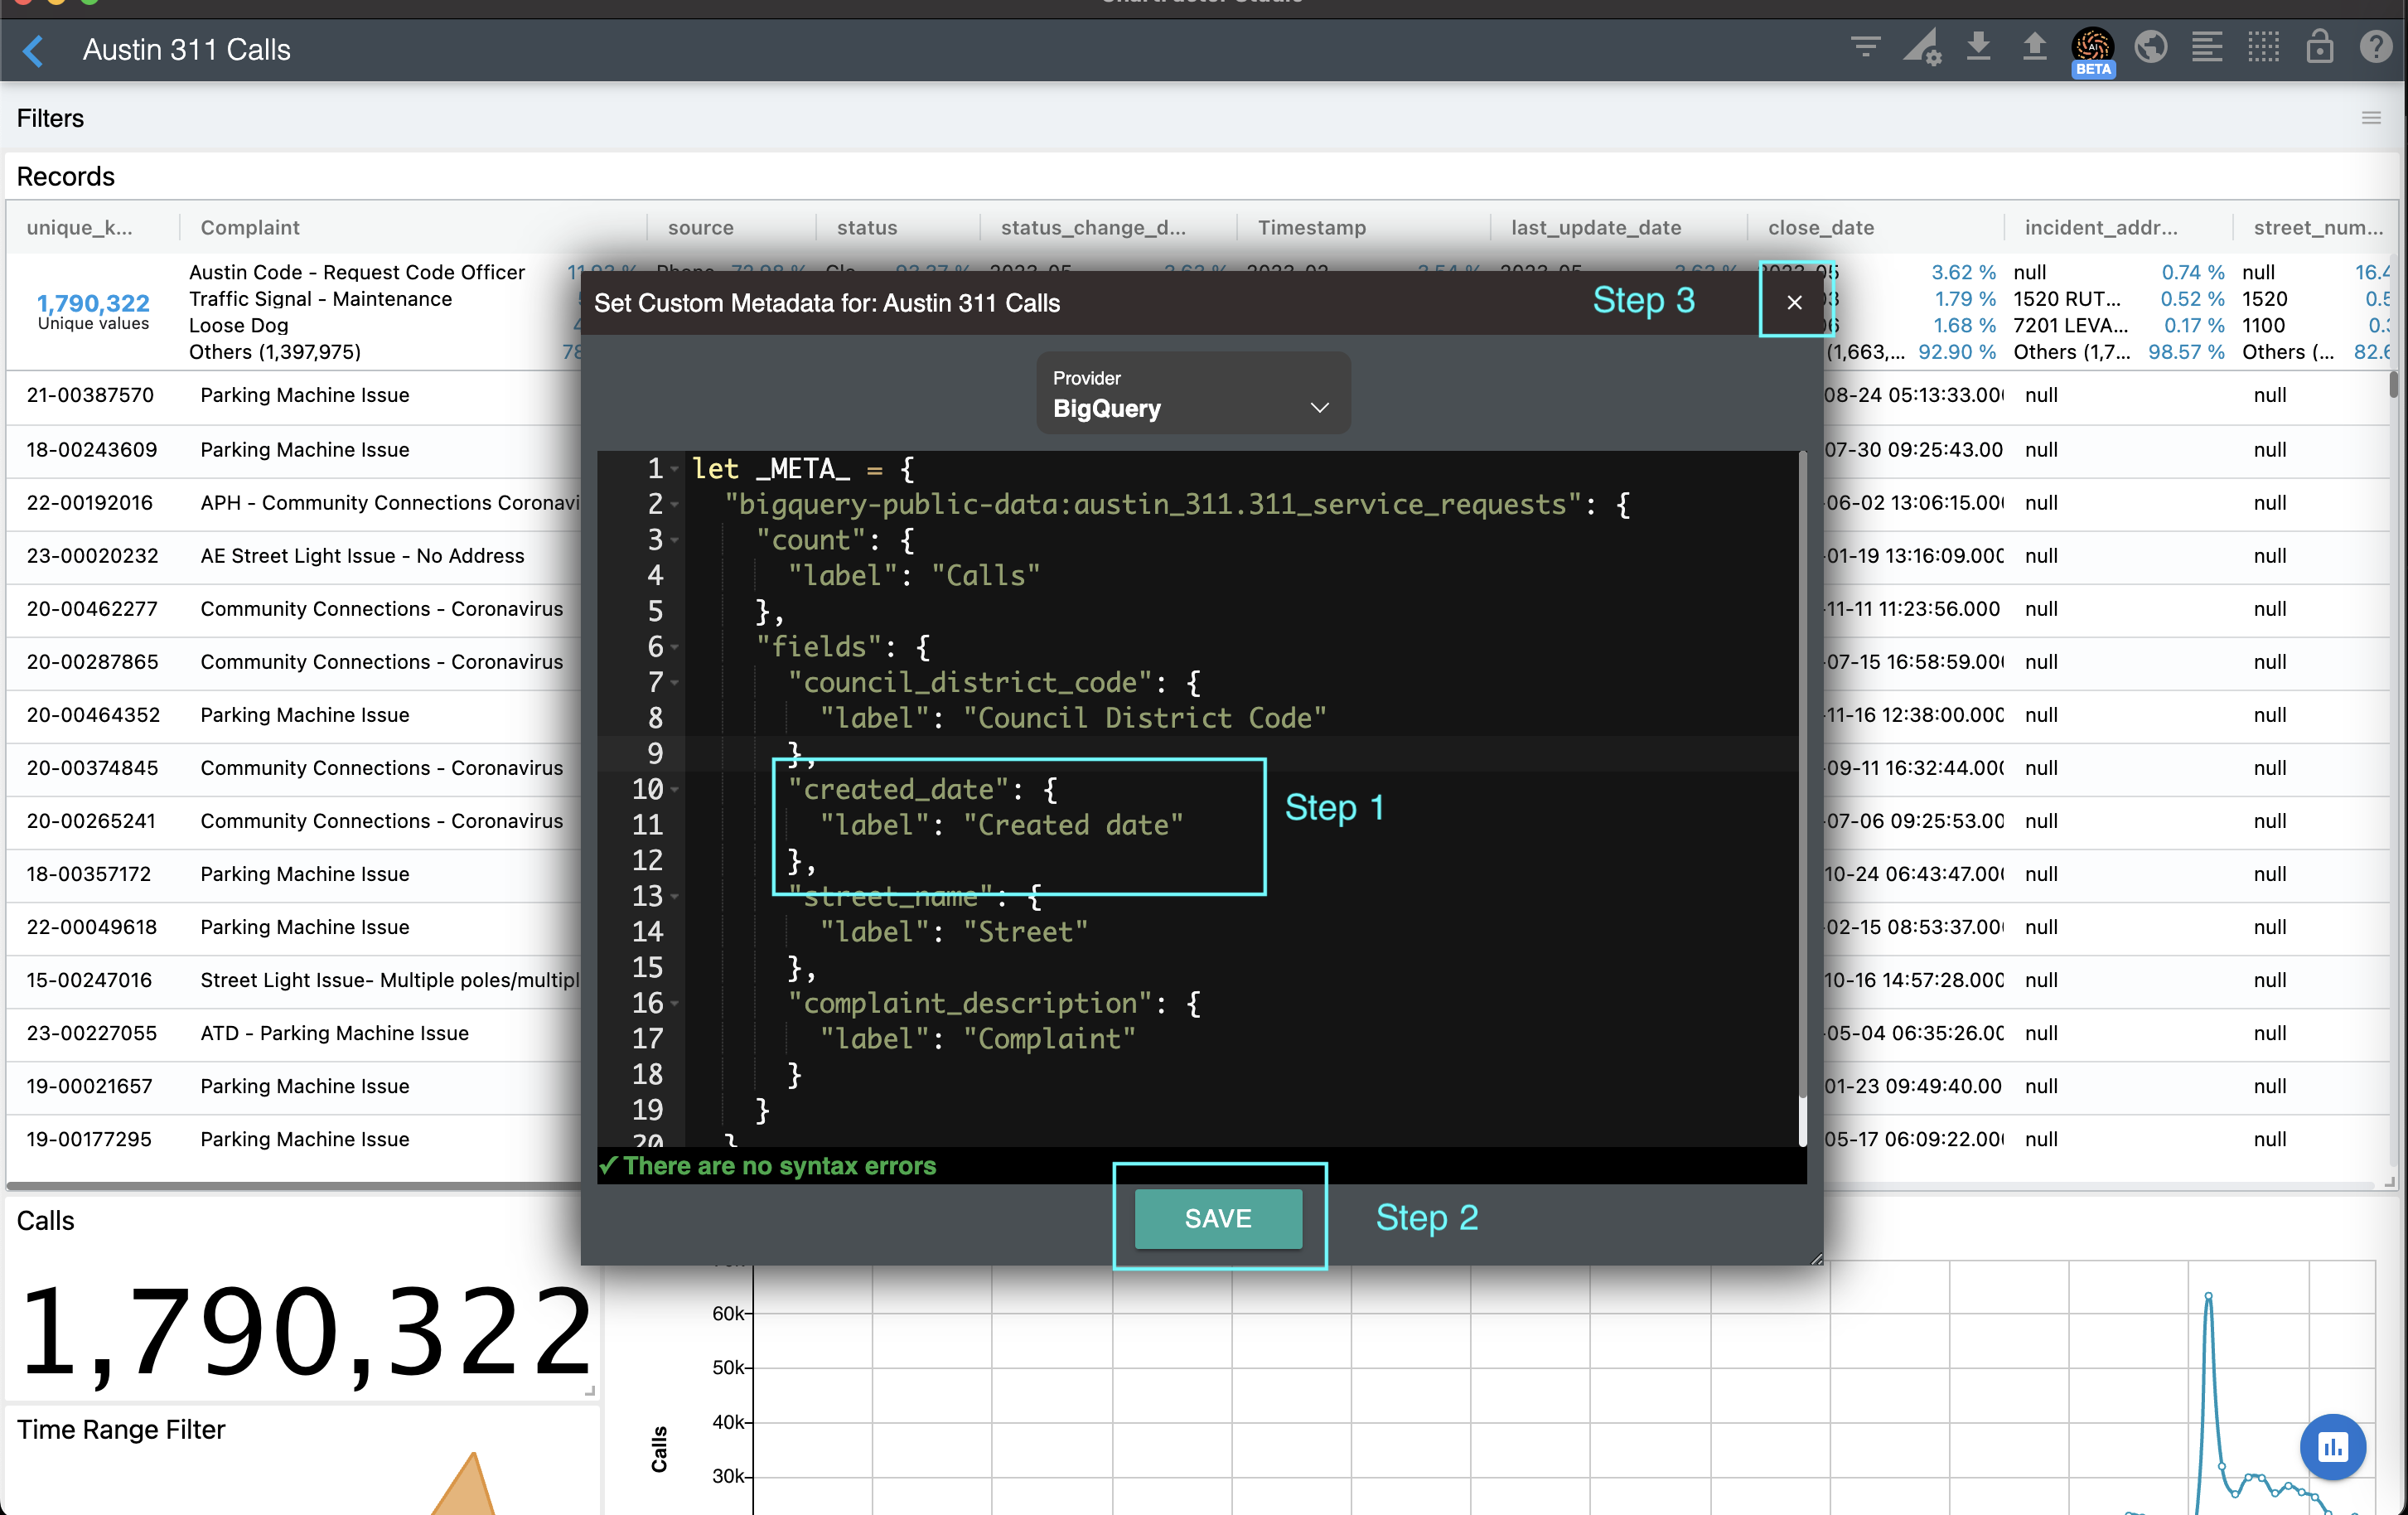
As an example, change the label of the created_date field to "Created Date" instead of "Timestamp". Then, press the SAVE button and close the dialog as shown below.
After closing the dialog, your visualizations will render with the field labels and types specified in the metadata as shown below.