Network Chart
A network graph is designed to allow the visualization of relational information. ChartFactor has two types of network charts: one that comes in the standard library called Graph and one more flexible and sofisticated called Network that comes in its own package.
Comparison between the Graph Chart and the Network Chart
| Feature | Graph Chart | Network Chart |
|---|---|---|
| Simple Graph Visualization | Yes | Yes |
| Directed Graph | No | Yes |
| Nodes Custom Styles | No | Yes |
| Edges Custom Styles | No | Yes |
| Static layout (specific x and y) | Yes | Yes |
| Force Layout | Yes | Yes |
| Circle Layout | No | Yes |
| Grid Layout | No | Yes |
| CoSE Layout | No | Yes |
| Dagre Layout | No | Yes |
| Spread Layout | No | Yes |
| Concentric Layout | No | Yes |
| Custom event listeners | No | Yes |
Creating a Basic Graph Chart with local data
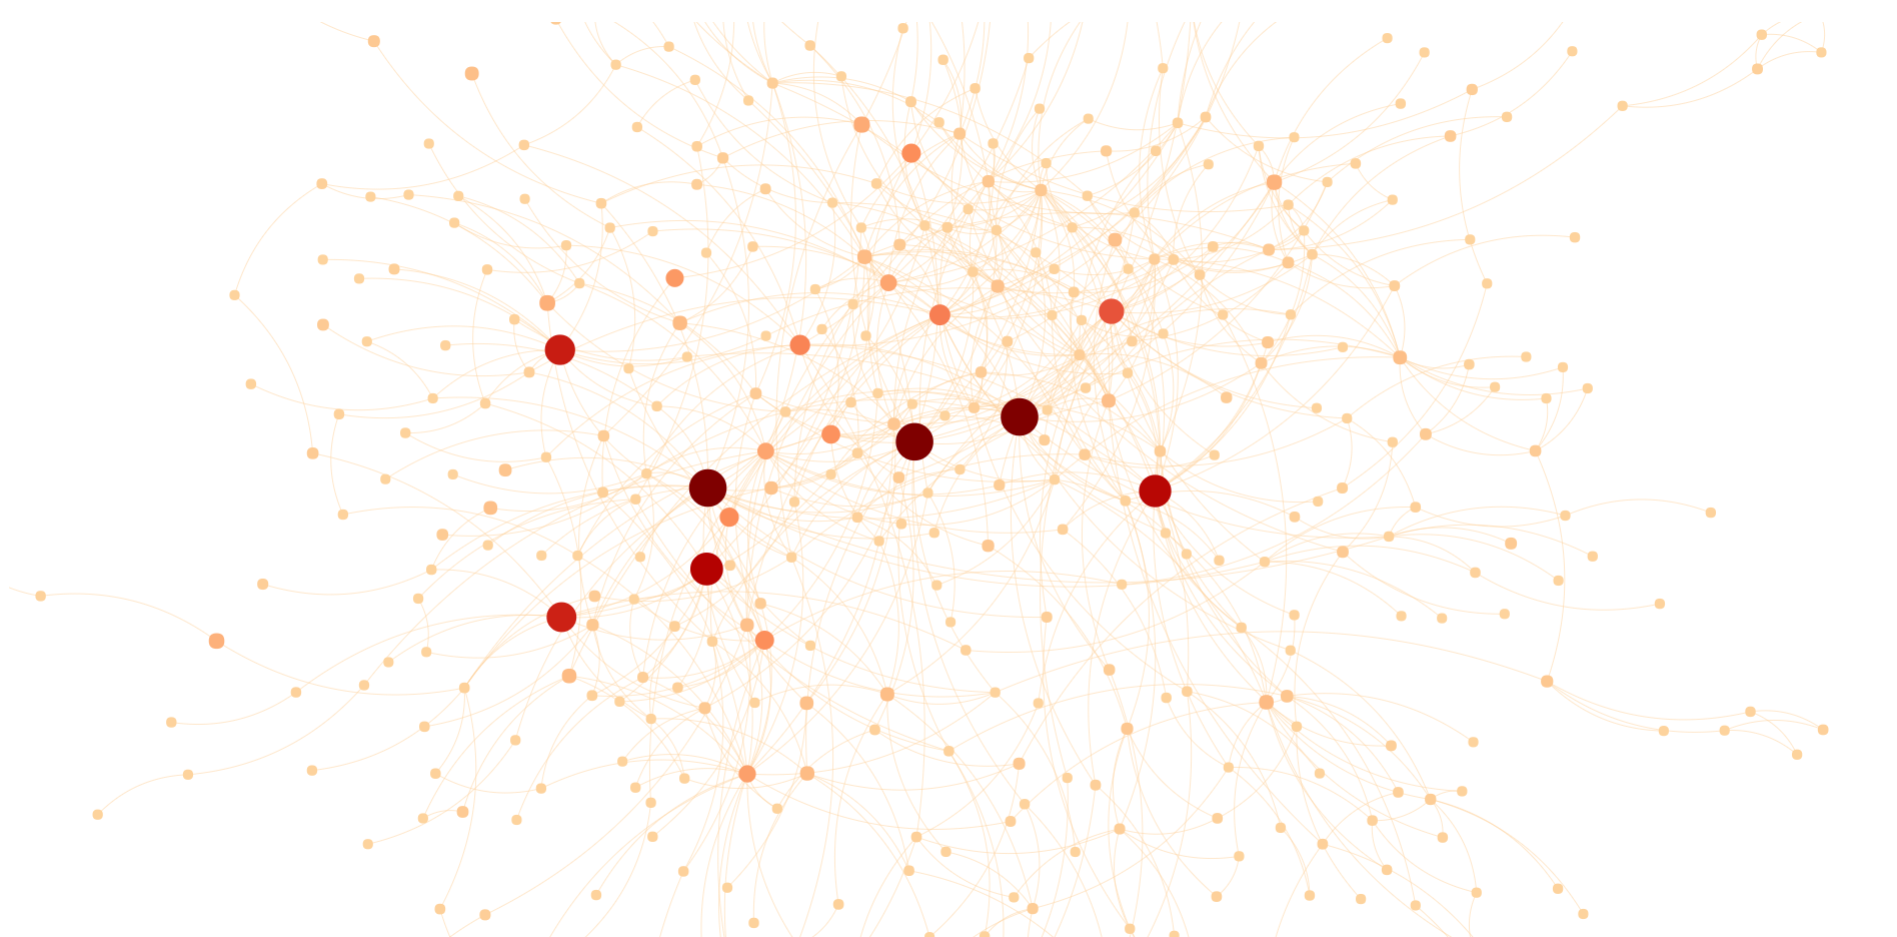
In this example we will create a Graph chart and feed it with static data. Note that only edge information is required to render the graph.
1 2 3 4 5 6 7 8 9 10 11 12 13 14 15 16 17 18 19 20 21 22 23 24 25 26 27 28 29 30 31 32 33 34 35 36 37 38 39 40 41 42 43 44 45 46 47 48 49 50 51 52 53 54 55 | |
The previous code will render the Graph Chart below:
Creating a Graph chart with provider data
It is recommended before reading this section, to read the documentation on Multiple Queries (click here). To support graph charts, we make use of Chartfactor's multiple query capabilities as we show below:
1 2 3 4 5 6 7 8 9 10 11 12 13 14 15 16 17 18 19 20 21 22 23 24 25 26 27 28 29 30 31 32 33 34 35 36 37 38 39 40 41 42 43 44 45 46 47 48 49 50 51 52 53 | |
let grp = cf.Attribute('id').limit(1200).sort('asc', metrics[0]);.
The edges query obtains the relation betwen nodes. It is using a pivot-style query grouping by source and target, as specified in the rows() function above. Here is the code used: .rows('source', 'target'). The default limit for a rows() query is 1000. You can override this limit by using the limit() function. In the example above, the limit is set to 500.
Note
It is mandatory that the query to retrieve the node is called "nodes" and the query to retrieve edges is called "edges". If you want to see an example of this code in action click here.
Creating a Network Chart with static data
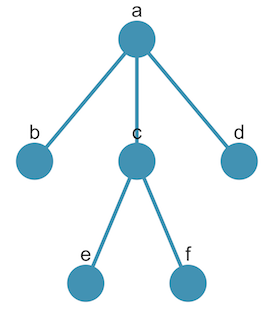
In this example we will create a Network chart and feed it with static data. Note that only edge information is required to render the network. Node information is optional.
1 2 3 4 5 6 7 8 9 10 11 12 13 14 15 16 17 | |
The previous code will render the Network Chart below:
Adding custom styles
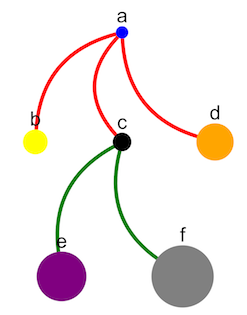
The next example uses the same data as the previous example. In addition, it defines a style array to be assigned to the network chart. Each object in the style array must have a selector attribute (node, edge, or id) and a style attribute containing css-like styles to be applied to network chart.
1 2 3 4 5 6 7 8 9 10 11 12 13 14 15 16 17 18 19 | |
The previous code will render the Network Chart below:
Using the data to style nodes and edges
We can use properties of the data to specify styles of nodes and edges. Use the syntax 'data(propertyName)' to assign the value of that property to a style object. Let's modify our previous example to use this feature:
1 2 3 4 5 6 7 8 9 10 11 12 13 14 15 16 17 18 19 20 21 22 23 24 25 26 27 28 29 30 31 32 33 34 35 36 37 38 39 40 41 42 | |
The previous code will render the Network Chart below:
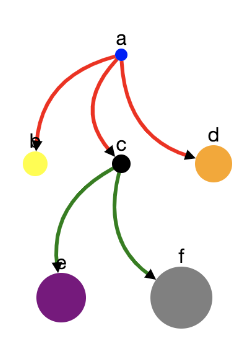
Setting arrows to edges
To set arrows on the edges we can modify the properties \<position>-arrow-shape, \<position>-arrow-color, \<position>-arrow-fill and \<position>-arrow-scale.
Valid values for \<position> are: * source : Pointing towards the source node, at the end of the edge. * mid-source : Pointing towards the source node, at the middle of the edge. * target : Pointing towards the target node, at the end of the edge. * mid-target: Pointing towards the target node, at the middle of the edge.
Valid shapes are: * triangle * triangle-tee * triangle-cross * triangle-backcurve * vee * tee * square * circle * diamond * none
1 2 3 4 5 6 7 8 9 10 11 12 13 14 15 16 17 | |
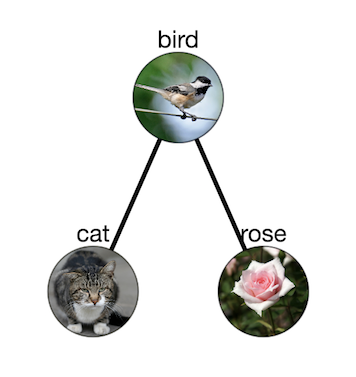
Images in Nodes
To put an image in a node you must modify the properties 'background-image' and 'background-fit' in the style of the node as well as specify the path of the image in the data of the node or create a custom selector using the id of the node to specify the path of the background image as shown below:
1 2 3 4 5 6 7 8 9 10 11 12 13 14 15 16 17 18 19 20 21 22 23 24 25 26 27 28 29 30 31 32 33 34 35 36 37 38 39 40 41 42 43 44 45 46 47 48 49 50 | |
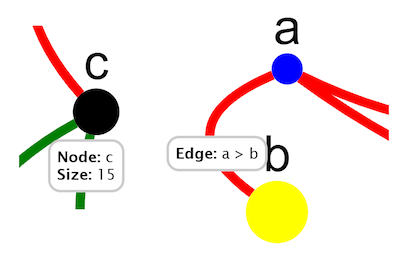
Custom Tooltips
Using the same data from the previous example we can develop a small example of how to implement custom tooltips that show the size in addition to the node identifier.
1 2 3 4 5 6 7 8 9 10 11 12 13 14 15 16 17 18 19 20 21 22 | |
The previous code will render the Tooltips below:
Available layouts
| Layout Name | Node Position | Config. Variables | Best Scenarios |
|---|---|---|---|
| preset | preset on data | none | when you have the positions that each node will have |
| random | random | none | if is a small graph |
| force | calculated | Edge length, Node spacing | good to detect association and orphan nodes |
| circle | on the perimeter of a circle | none | if is a small graph |
| grid | on a grid | spacingFactor | a graph without many connections |
| cose | calculated | idealEdgeLength, nodeOverlap, nodeRepulsion, edgeElasticity, gravity, etc. | a graph without many connections |
| dagre | calculated | none | non-cyclic graph |
| spread | calculated | minDist | a graph without many connections |
| concentric | calculated | concentric (func), levelWidth (func) | graphs in which few nodes have relationships with many nodes |
In this demonstration you can try each of the layouts. (click here)
Registering a click listener
Setting a listener to an event in a graph is done in a similar way as to any other chartfactor visualization. Here is an example:
1 2 3 4 5 6 7 8 9 10 11 12 | |
Creating a Network chart with provider data
It is recommended before reading this section, to read the documentation on Multiple Queries (click here). To support network charts, we make use of Chartfactor's multiple query capabilities as shown below:
1 2 3 4 5 6 7 8 9 10 11 12 13 14 15 16 17 18 19 20 21 22 23 24 25 26 27 28 29 30 31 32 33 34 35 36 37 38 39 40 41 42 43 44 | |
The edges query obtains the relation betwen nodes. The example above is using a raw data query to retrieve source and target columns, as specified in the fields() function. Here is the code used: .fields('source', 'target'). The default limit for raw data queries is 100. You can override this limit by using the limit() function. In the example above, the limit is set to 1000.
The nodes query in the example above is also using a raw data query to retrieve id, value, y, x, label, and color fields. Same as with the edges query, the default limit for raw data queries is 100. You can override this limit by using the limit() function. In the example above, the limit is set to 1000.
Note
It is mandatory that the query to retrieve the node is called "Nodes" and the query to retrieve edges is called "Edges". If you want to see an example of this code in action click here.
Inject urls of dependency libraries:
In order to not increase the size of the library with the dependencies of an uncommon visualization, by default, ChartFactor does not load the dependencies of the network graph. These are loaded when the graph is instantiated and are left in cache. These are loaded from the official CDN but if you do not have extranet access or for reasons of speed you want to serve them on your own servers, you can inject the addresses of these libraries and they will be loaded in the following way. Example:
1 2 3 4 | |
Note
It is recommended to define global variables to inject the dependencies before loading the library. The following table shows all the dependencies that can be injected
| Vairable | Default Url |
|---|---|
| colaUrl | http://marvl.infotech.monash.edu/webcola/cola.min.js |
| cyColaUrl | https://cdn.jsdelivr.net/npm/cytoscape-cola@2.1.0/cytoscape-cola.min.js |
| cytoscapeUrl | https://cdnjs.cloudflare.com/ajax/libs/cytoscape/3.2.8/cytoscape.min.js |
| dagreUrl | https://cdn.rawgit.com/cpettitt/dagre/v0.7.4/dist/dagre.min.js |
| cyDagreUrl | https://cdn.rawgit.com/cytoscape/cytoscape.js-dagre/1.5.0/cytoscape-dagre.js |
| weaverUrl | https://cdn.rawgit.com/maxkfranz/weaver/v1.2.0/dist/weaver.min.js |
| cySpreadUrl | https://cdn.rawgit.com/cytoscape/cytoscape.js-spread/1.3.1/cytoscape-spread.js |
| cyCanvasUrl | https://unpkg.com/cytoscape-canvas/dist/cytoscape-canvas.js |
Or you can inject a bundle with all dependencies minified:
| Vairable | Default Url |
|---|---|
| graphBundleUrl | https://chartfactor.com/wp-content/lib/cf_graph_bundle.min.js |