Heat Map
Introduction
The Heat Map allows the visualization of data in a Cartesian plane of two dimensions, which is especially useful to detect variations of the data values in a certain time range or in the relation of two attributes.
A Heat Map can be obtained with the following code:
1 2 3 4 5 6 7 8 9 10 11 12 13 14 15 16 17 18 19 20 21 22 23 24 25 26 27 28 29 30 31 32 33 34 | |
The previous code will render a Heat Map like the one below:
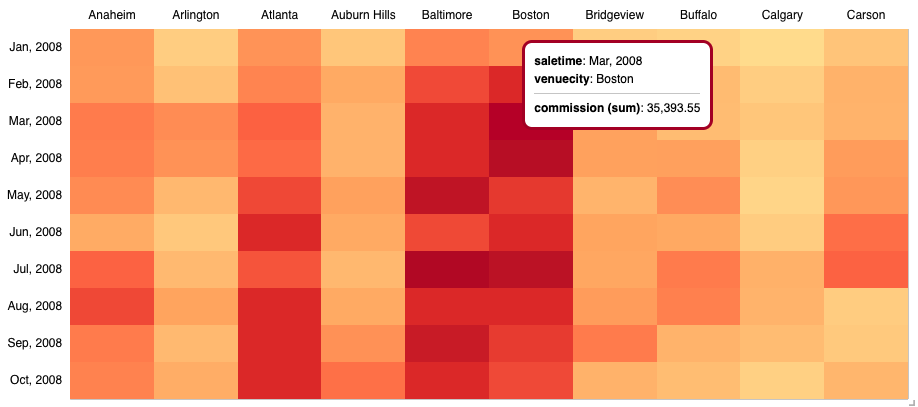
As you can see in the previous Heat Map example, two groups are used, one for the row and one for the column, sorted in an ascending order using their own attributes as criterion of order. Notice that the chart margins are also specified using the grid property. See the Grid documentation for more information on how to specify them.
Configuration Options
legend
You can render a legend for your Heat Map as specified in our Legend documentation.
color
You can specify how your Heat Map should be colored. Please refer to our Color documentation for details.
grid
You can specify the margins of your Heat Map. Please refer to our Grid documentation for details.
transpose
This setting allows you to transpose the values in your Heat Map, swapping rows and columns without re-querying.
1 2 | |
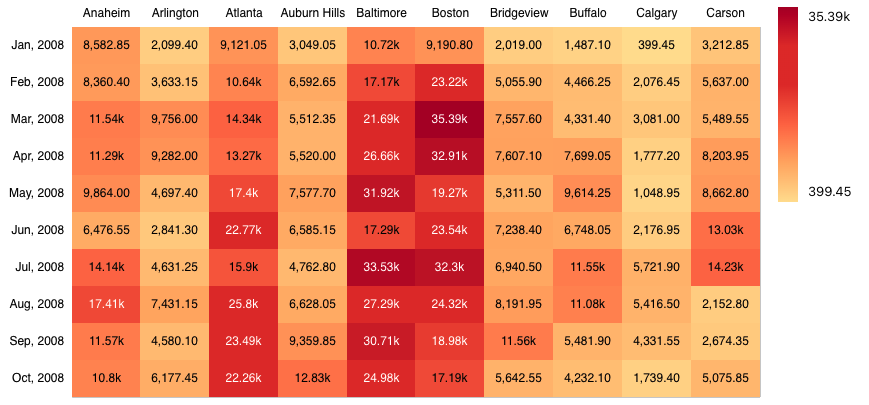
showValues
You can tell your Heat Map to render its metric values. These values show when there is enough space in the Heat Map so make sure to size it appropriately. The default value of this option is false.
The property settings below illustrate how to use showValues and legend settings.
1 2 | |
The resulting visualization is shown below.
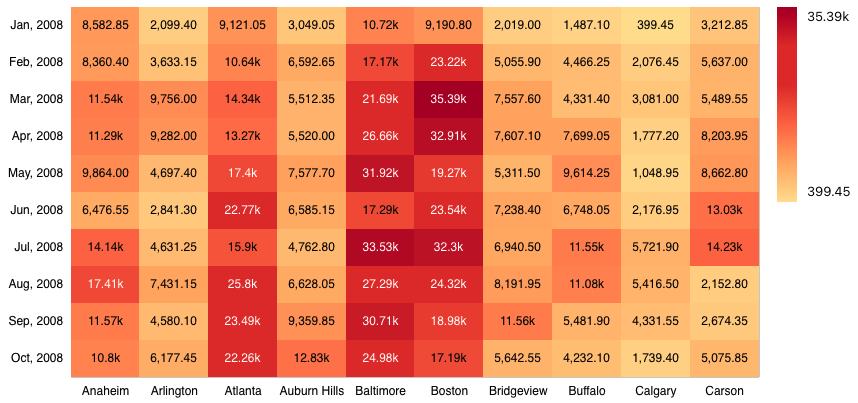
xAxisPosition
This property allows to set the position of the x-axis. It admits 2 positions, top and bottom. Default is top. The following code illustrates how to change the position to 'bottom'.
1 | |
The resulting visualization is shown below.