Data List
The Data List is an ag-grid based visualization that displays raw data. It is useful when you need to render your raw data using specific html and styles using a custom row renderer. Refer to the Raw Data Table if you need to render your raw data in a table format.
Rendering the Data List
The Data List is different than aggregated visualizations in that it uses .field() instead of .groupby() and it doesn’t use .metrics(). An example with partial code is below.
1 2 3 4 5 6 7 8 9 10 11 12 13 14 15 16 17 18 19 | |
This will render a Data List similar to the one below:
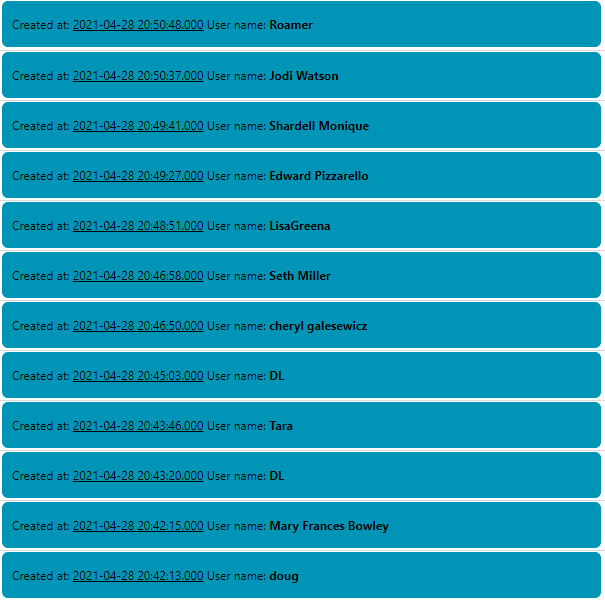
The important functions to render a Data List are explained next.
Fields
The .fields() function is used when querying raw data. You can pass the needed field names in a comma-sepparated fashion. Example:
1 | |
You can also pass an array of Field objects. In either case, ChartFactor will query the specified fields and pass them to your customItemRender.
Note
If you do not specify any field in the .fields() function, ChartFactor defaults to query all fields available in your datasource.
Custom row renderer
The Data List visualization requires you to provide a customItemRenderer setting with the function that renders your data. See the example below:
1 2 3 4 5 6 7 8 9 | |
Sort
Sort order can be specified as below.
1 2 3 4 5 | |
Key field
Although keyField is an optional setting, it is required for the Data List to work properly with the Time Slider's data player. It is needed to properly merge new data as it arrives. Example:
1 | |
Data streaming
As mentioned earlier, the Data List visualization works together with the Time Slider's data player to show new data as it arrives.
When users press "Play" on the Time Slider, assuming you are sorting your Data List by datetime descending, you can visualize newly arrived data at the top of the Data List. Old data is removed at the bottom to conserve memory. You can configure a page size using the .limit() function to specify how much data you want to hold in the Data List at any given time.
1 | |
When the Time Slider player is stopped, the Data List visualization automatically switches to its infinite scroll mode where new data pages of the specified limit are retrieved as users scroll up and down.
Note
The default limit value is 100