Client Filters
Most of the time, when filtering data, we want to apply filters directly to the big data or analytical server. To do that, we use the Aktive filter() method passing a Filter object. This action will bring only the filtered data.
However, sometimes we want to let the visualization to do the filtering in the most appropriate visual way. For example to keep the original data and just highlight the filtered one. Sometimes this is more effective visualy speaking for comparison. Let's take a look at the following example filtered by 'Lyric Opera House':
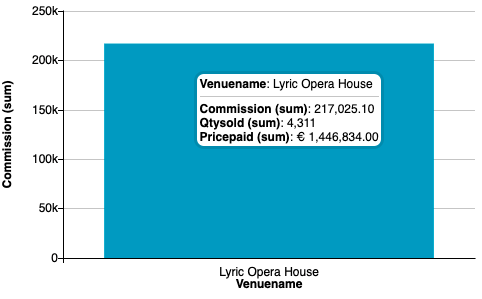
The bar looks great and it shows what it's supposed to. But if instead of filtering we do client-filtering:

Then we get a better perspective comparing "Lyric Opera House" agains other venues.
Enabling client filters
There are two ways you can use client filters in your visualizatiion (when supported):
-
The first one by using the AQL
.clientFilter()property for the given filter instead of.filter().1 2 3
const filter = cf.Filter('venuename').in('Lyric Opera House'); myChart.clientFilter(filter).execute() -
The second one is through the Interaction Manager. In this case, the Interaction Manager automatically takes care of building and setting client filters for the visualizations that you specify the
clientFiltersrule. See Interaction Manager's Filter Rules for more information.
Supported visualizations
The following visualizations support client filters when configured with one group-by attribute:
- Bars
- Pie
- Donut
- Scatter Plot
- Floating Bubbles
- Tree Map
- Word Cloud
- Disk
- Slicer
- Vector Map
- Geo Map
The following visualization supports client filters when configured with one group-by attribute and/or one column-group-by attribute:
- Heat Map
Note
- Client filters will ONLY apply as long as the filter's path (the filter's field name) matches the group-by attribute of the visualization
- Visualizations with two or more group-by attributes (e.g. Tree Map 2D) do not support client filters
Special Interaction Manager behavior
The Interaction Manager defaults client filters for the following special cases:
Trend and Area Line
Trend and Area Line visualizations are grouped by an attribute and time. When users select a point in these visualizations, the Interaction Manager always applies the selected date/time as a client filter. The effect is that the chart keeps showing the line but convey to users the point selected as illustrated below:
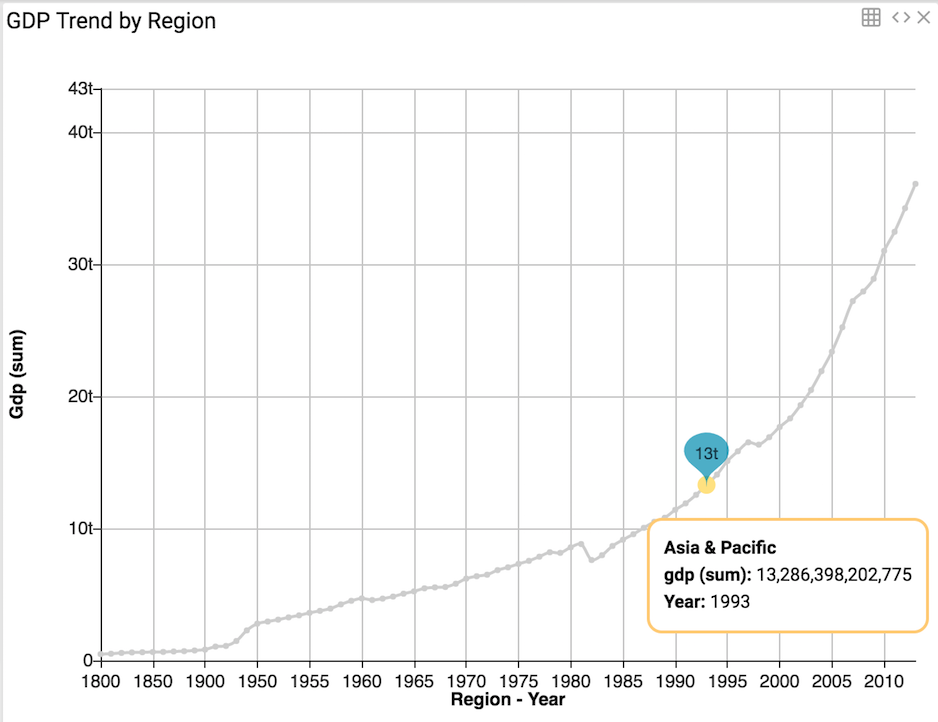
Internally, to display the line trend in this fashion, the Interaction Manager uses the Aktive clientFilter() method for the time field passing a Filter object as a parameter. The code below illustrates how this is done. Note that the Region filter is applied as a normal filter. This is why only one region shows in the chart. Note that the Year filter is applied as a Client Filter. This is why the chart can render the trend line completely and highlight the selected year.
1 2 3 4 5 6 7 8 9 10 11 12 13 14 15 16 17 18 19 20 21 22 | |
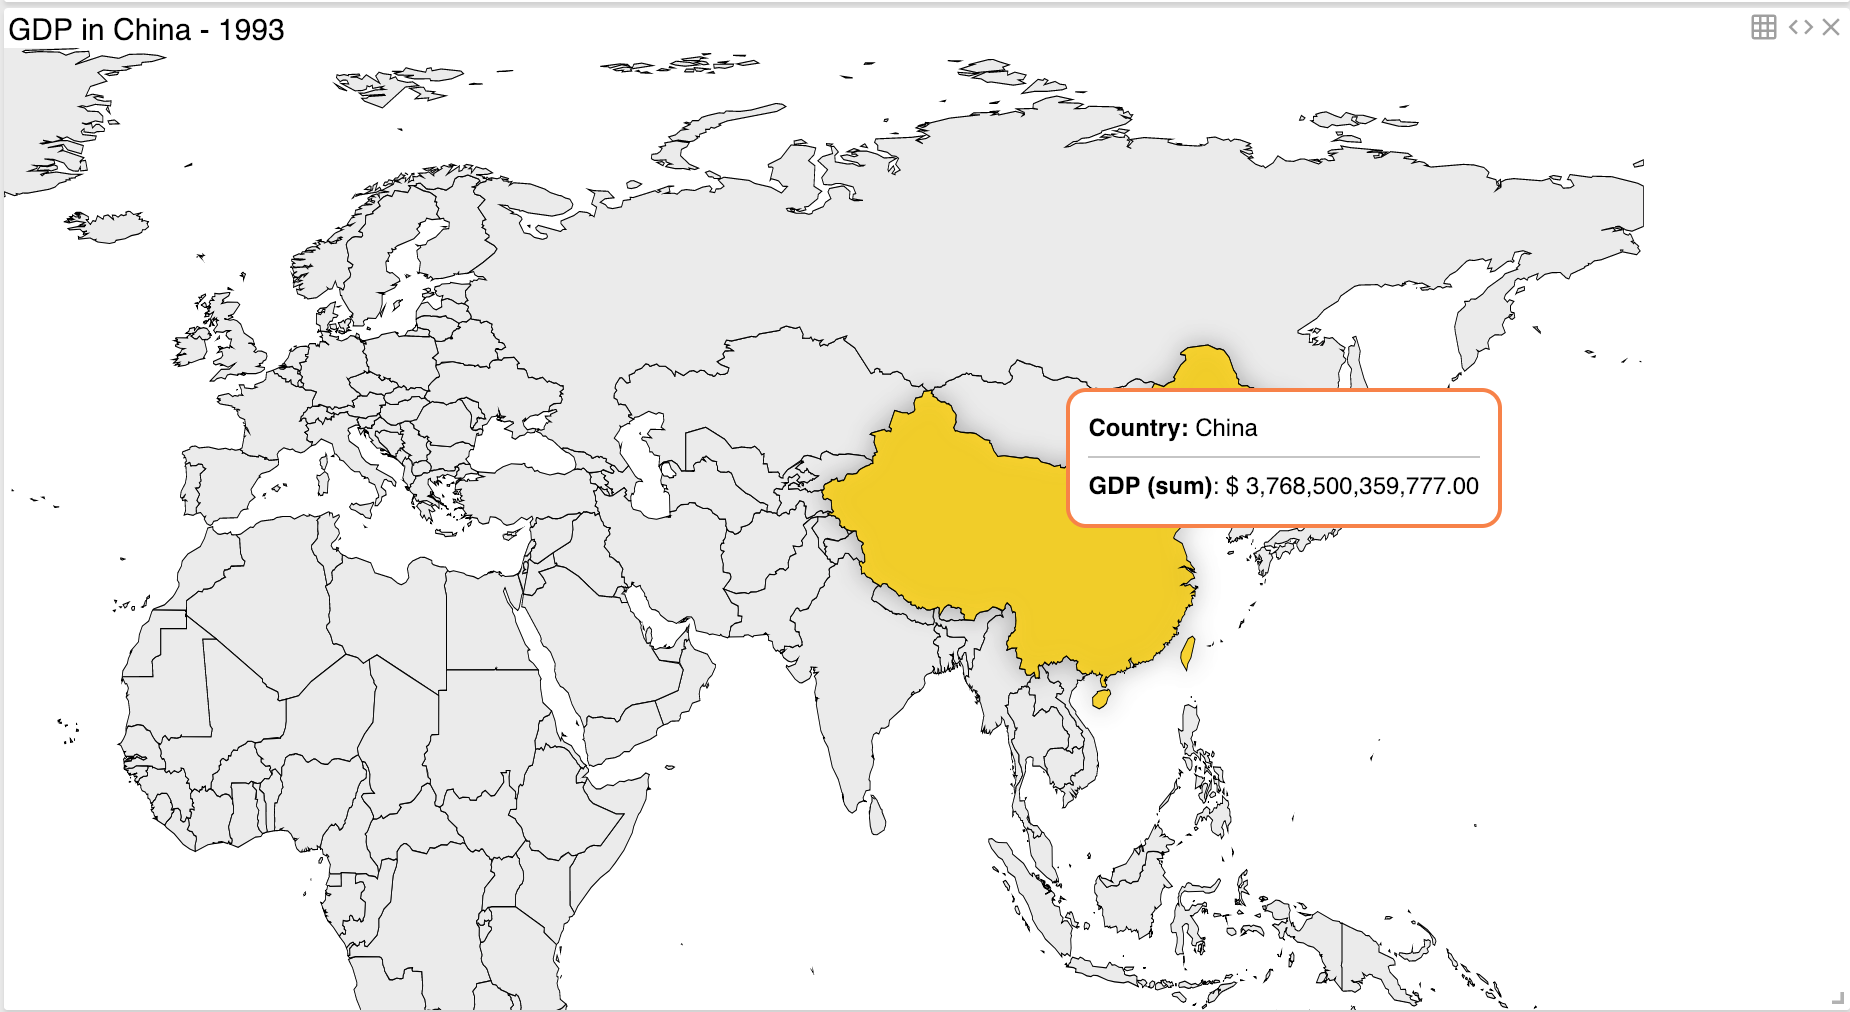
Vector Map and Geo Map
When region in the map is selected (e.g. Country), the Interaction Manager will apply the selected region as a filter. For the case of the Vector Map, it will use a client filter by default while the Geo Map needs the clientFilter rule to treat it as a one.
The selected region is highlighted while keeping the other regions available for selection. Internally, the Interaction Manager uses the Aktive clientFilter() method passing the Filter object as a parameter as shown below:
1 2 3 4 5 6 7 8 9 10 11 12 13 14 15 16 17 18 19 20 21 22 23 24 | |
The example code above renders the world map coloring only the country(ies) selected by the client filter and allowing users to select other countries as needed.