Using Custom Data
To display data into you visuals, it is not required to have a set up with one of the Data Providers supported by ChartFactor. Or perhaps you do have the setup but you need to process the data obtained from a previous query before displaying it. Or you just want to use your own data from somewhere else, like an external REST API, a JSON file or any other. In those cases you can use almost any of the visualizations provided by ChartFactor to inject your own data to it, as defined in the steps below.
1. Prepare the data
The data that you are going to inject should follow the structure below:
1 2 3 4 5 6 7 8 9 10 11 12 13 14 15 16 17 18 19 20 21 22 23 24 25 26 | |
The main data object should have the following properties:
groups: The names or full definition of the groups present in the formatted data
metrics: The names or full definition of the metrics present in the formatted data
data: The data following the ChartFactor data format. In the example above we assign the formattedData variable to this property. formattedData should be in the structure explained in the Data Format document. It is important that the names of the groups and metrics used in the formattedData array must match with those defined in the groups and metrics properties.
1.1 Injecting AQL-queried data
There is a difference between data created manually and data obtained using AQL queries with regard to the metric structure. The initial example above represents data created manually. The following example shows the data obtained using an AQL query. Notice how the aggregation functions of the Price and Speed metrics (i.e. sum and avg) are part of the structure when data is obtained using AQL queries.
1 2 3 4 5 6 7 8 9 10 11 12 13 14 15 16 17 18 19 20 21 22 23 24 25 26 27 28 | |
In these cases, the metrics definition must include the func property for each metric definition item as shown in the example below:
1 2 3 4 5 6 7 8 9 10 11 12 13 14 15 16 17 18 19 20 21 22 23 24 25 26 27 28 | |
2. Create an empty visual and inject the data
Since we don't need any providers, we'll create our empty visual and will inject the data like this :
1 2 3 4 5 | |
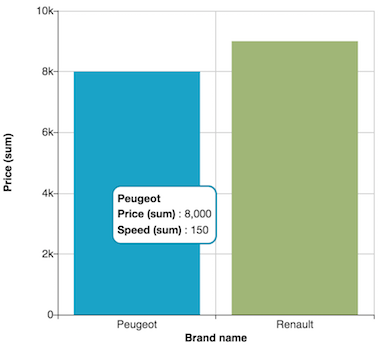
Then we obtain this:
Note
Custom data replaces queried data: Custom data will always have priority over queried data. This means that if a visual is rendering, or is going to render data from a previous query using .groupby(), _metrics(), _etc, and then custom data is injected to that same visual with .data() then the data from the query will be dropped in favor of the custom.