Online course: Your First Data Application
This quick tutorial shows you how to create a web data application to visualize COVID-19 Mobility Report data provided by Google BigQuery. If you don’t have a Google Cloud account, you can easily create your BigQuery account without a credit card.
Audience
This tutorial is meant for product managers, data scientists, data engineers, software engineers, and anyone interested in creating a lightweight interactive data application that can be directly deployed in the web server technology of your choice.
This class requires no software development knowledge. It does require typing a couple of commands on a terminal to unzip the generated data application and start a web server.
Video
The following video shows you step by step the content of this tutorial. You can also follow the written directions step by step on the next sections.
The App
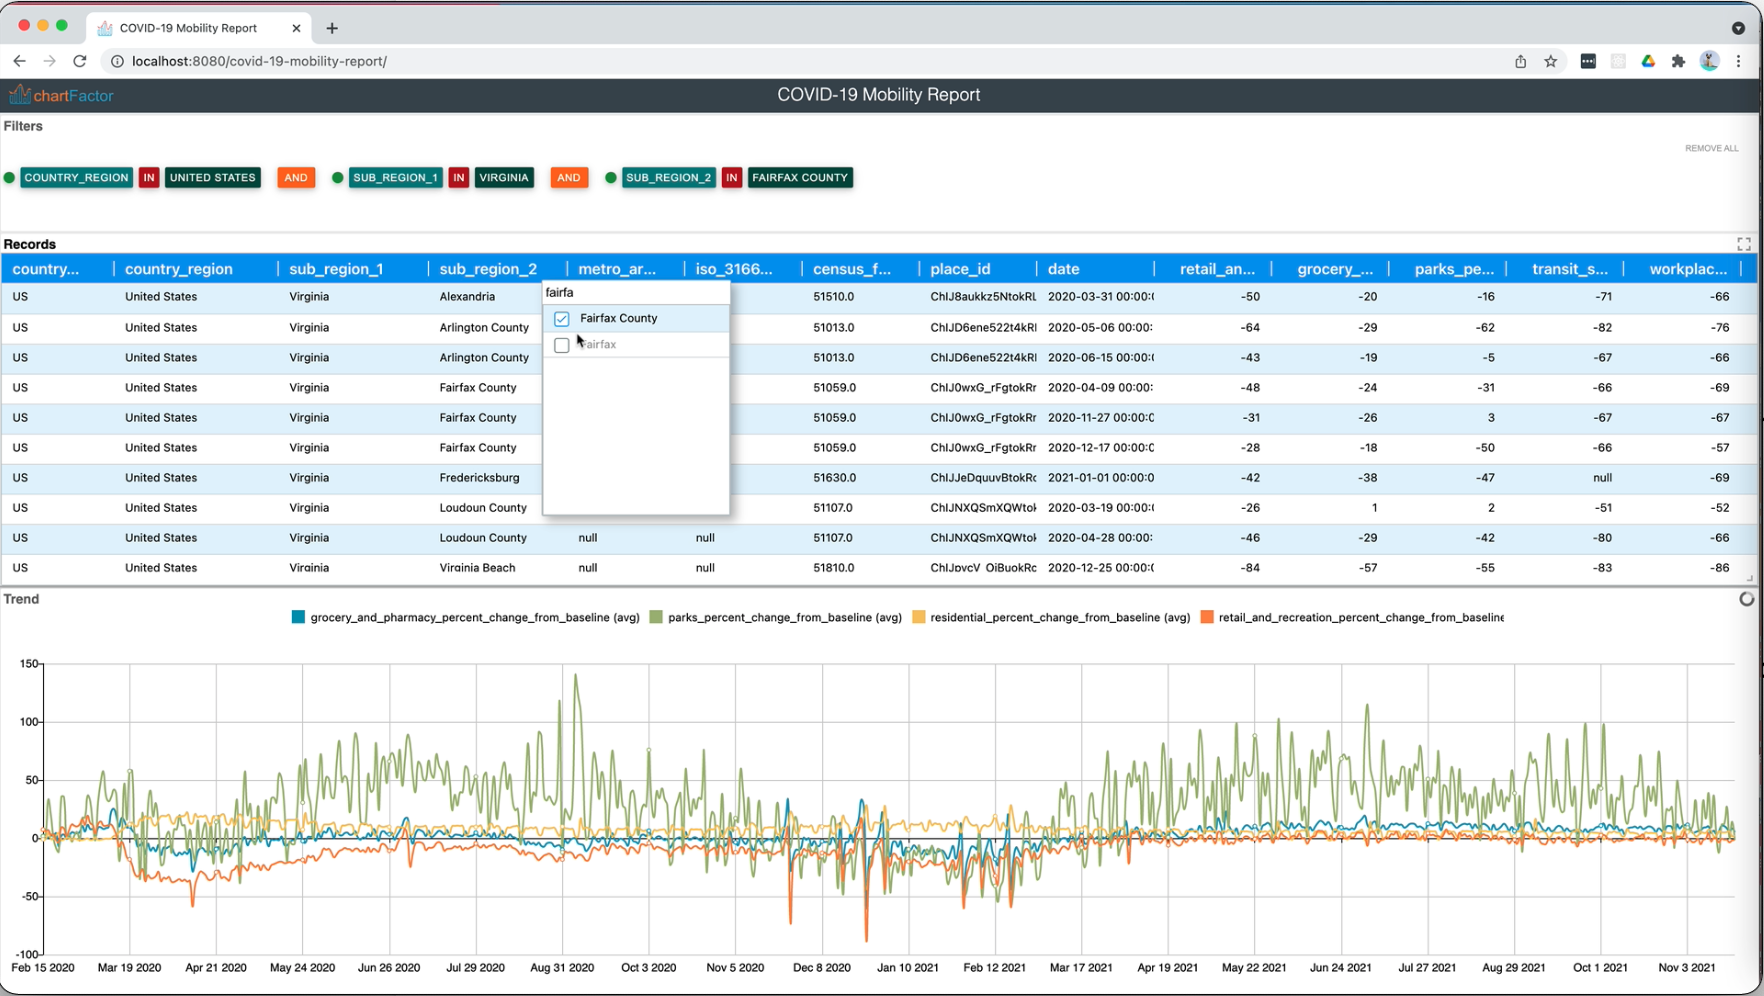
At the end of this tutorial, you will have created and deployed a web data application where you can interact with the Google Mobility Report Data, select different locations around the world, and see the mobility trends across multiple metrics.
The next section will walk you through the creation of this application step by step. You can also follow along with the video below.
Steps
-
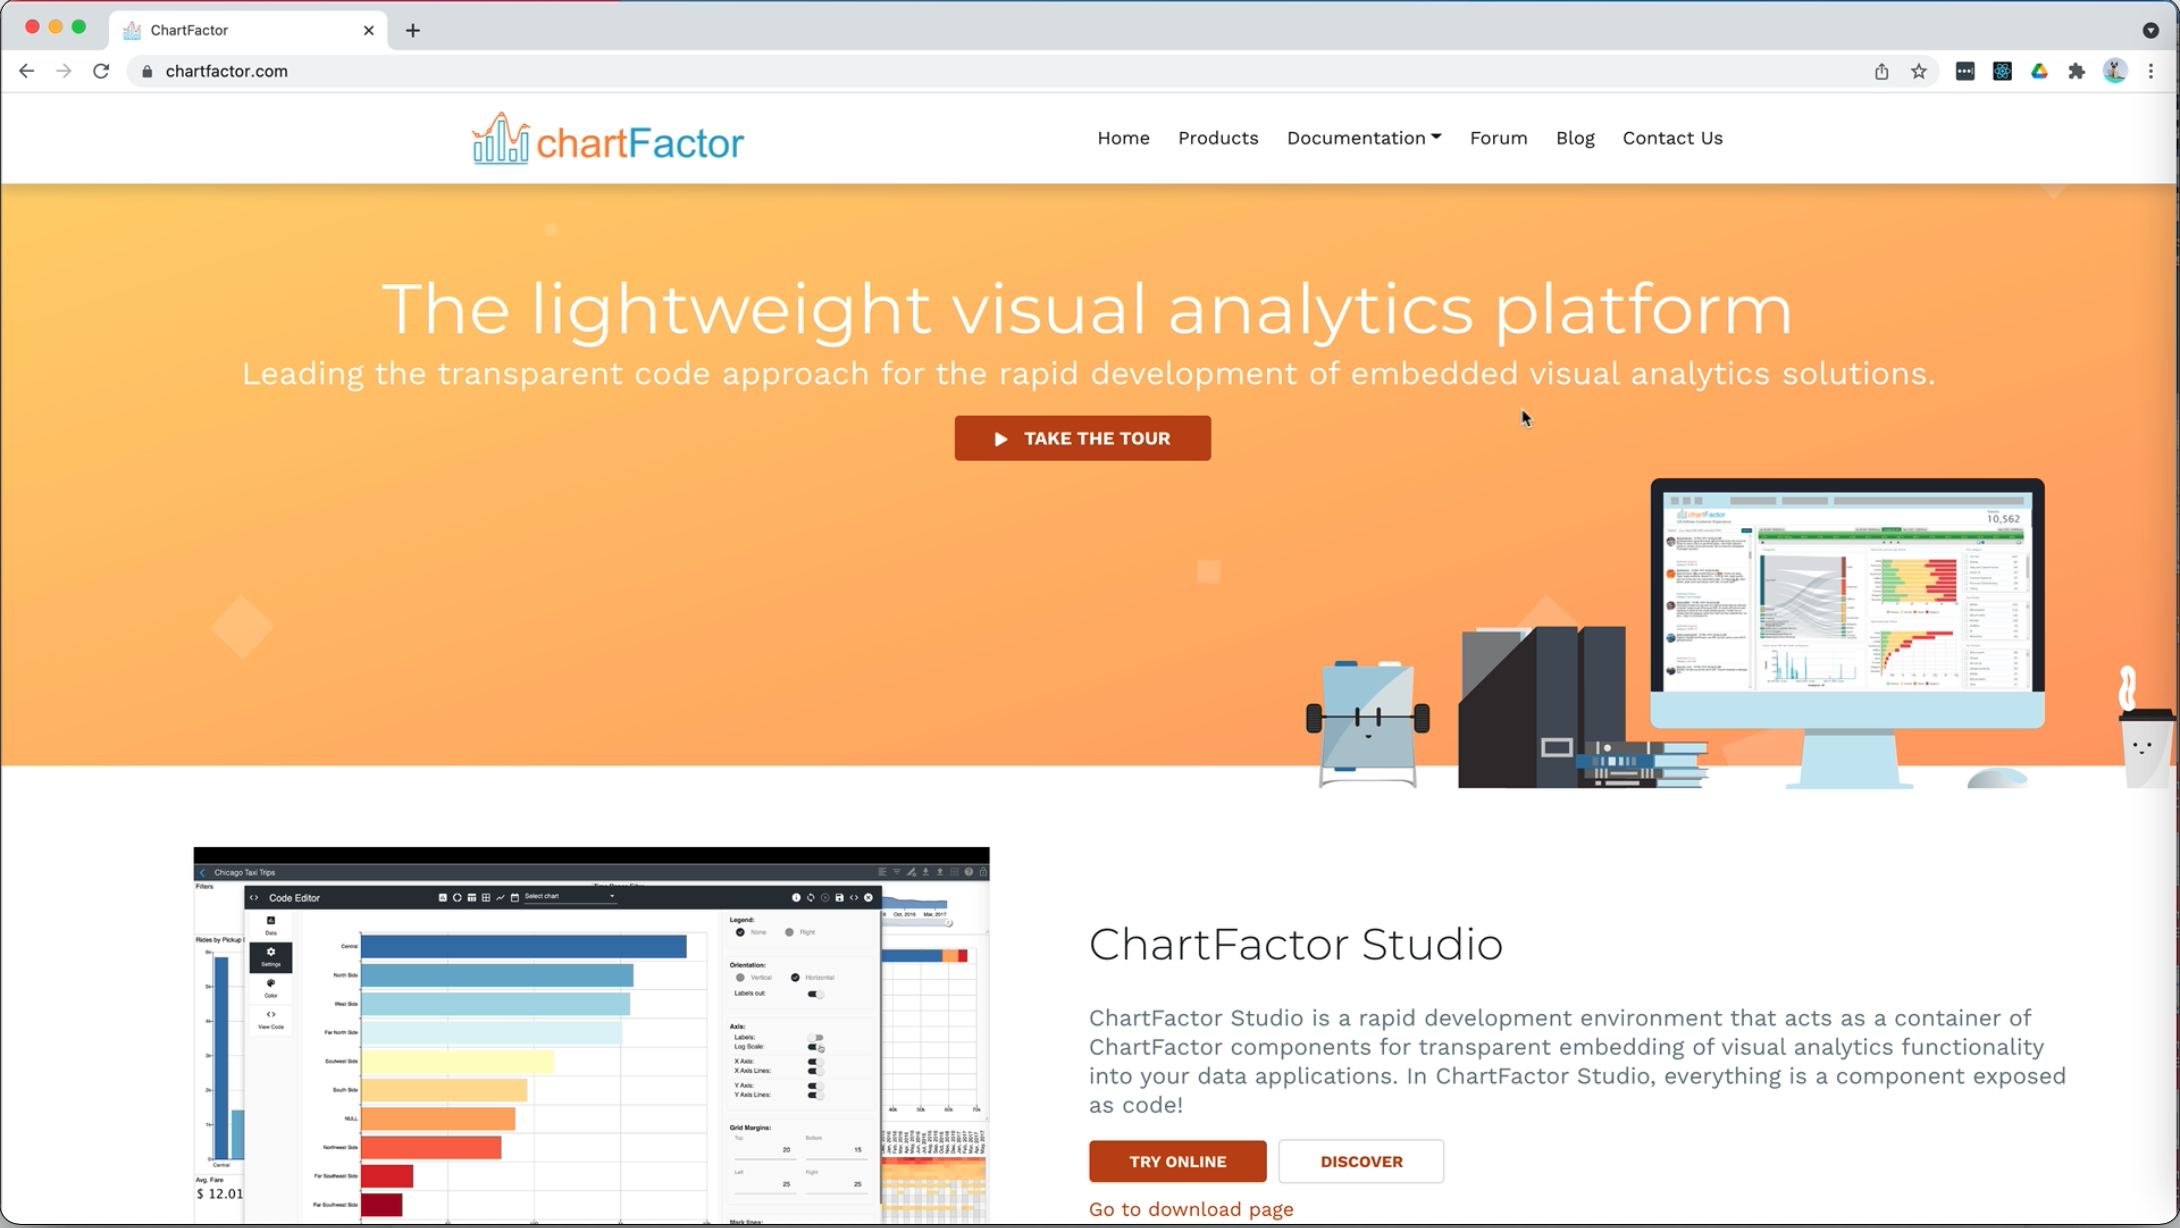
Open ChartFactor Studio from chartfactor.com by selecting the “Try Online” button
-
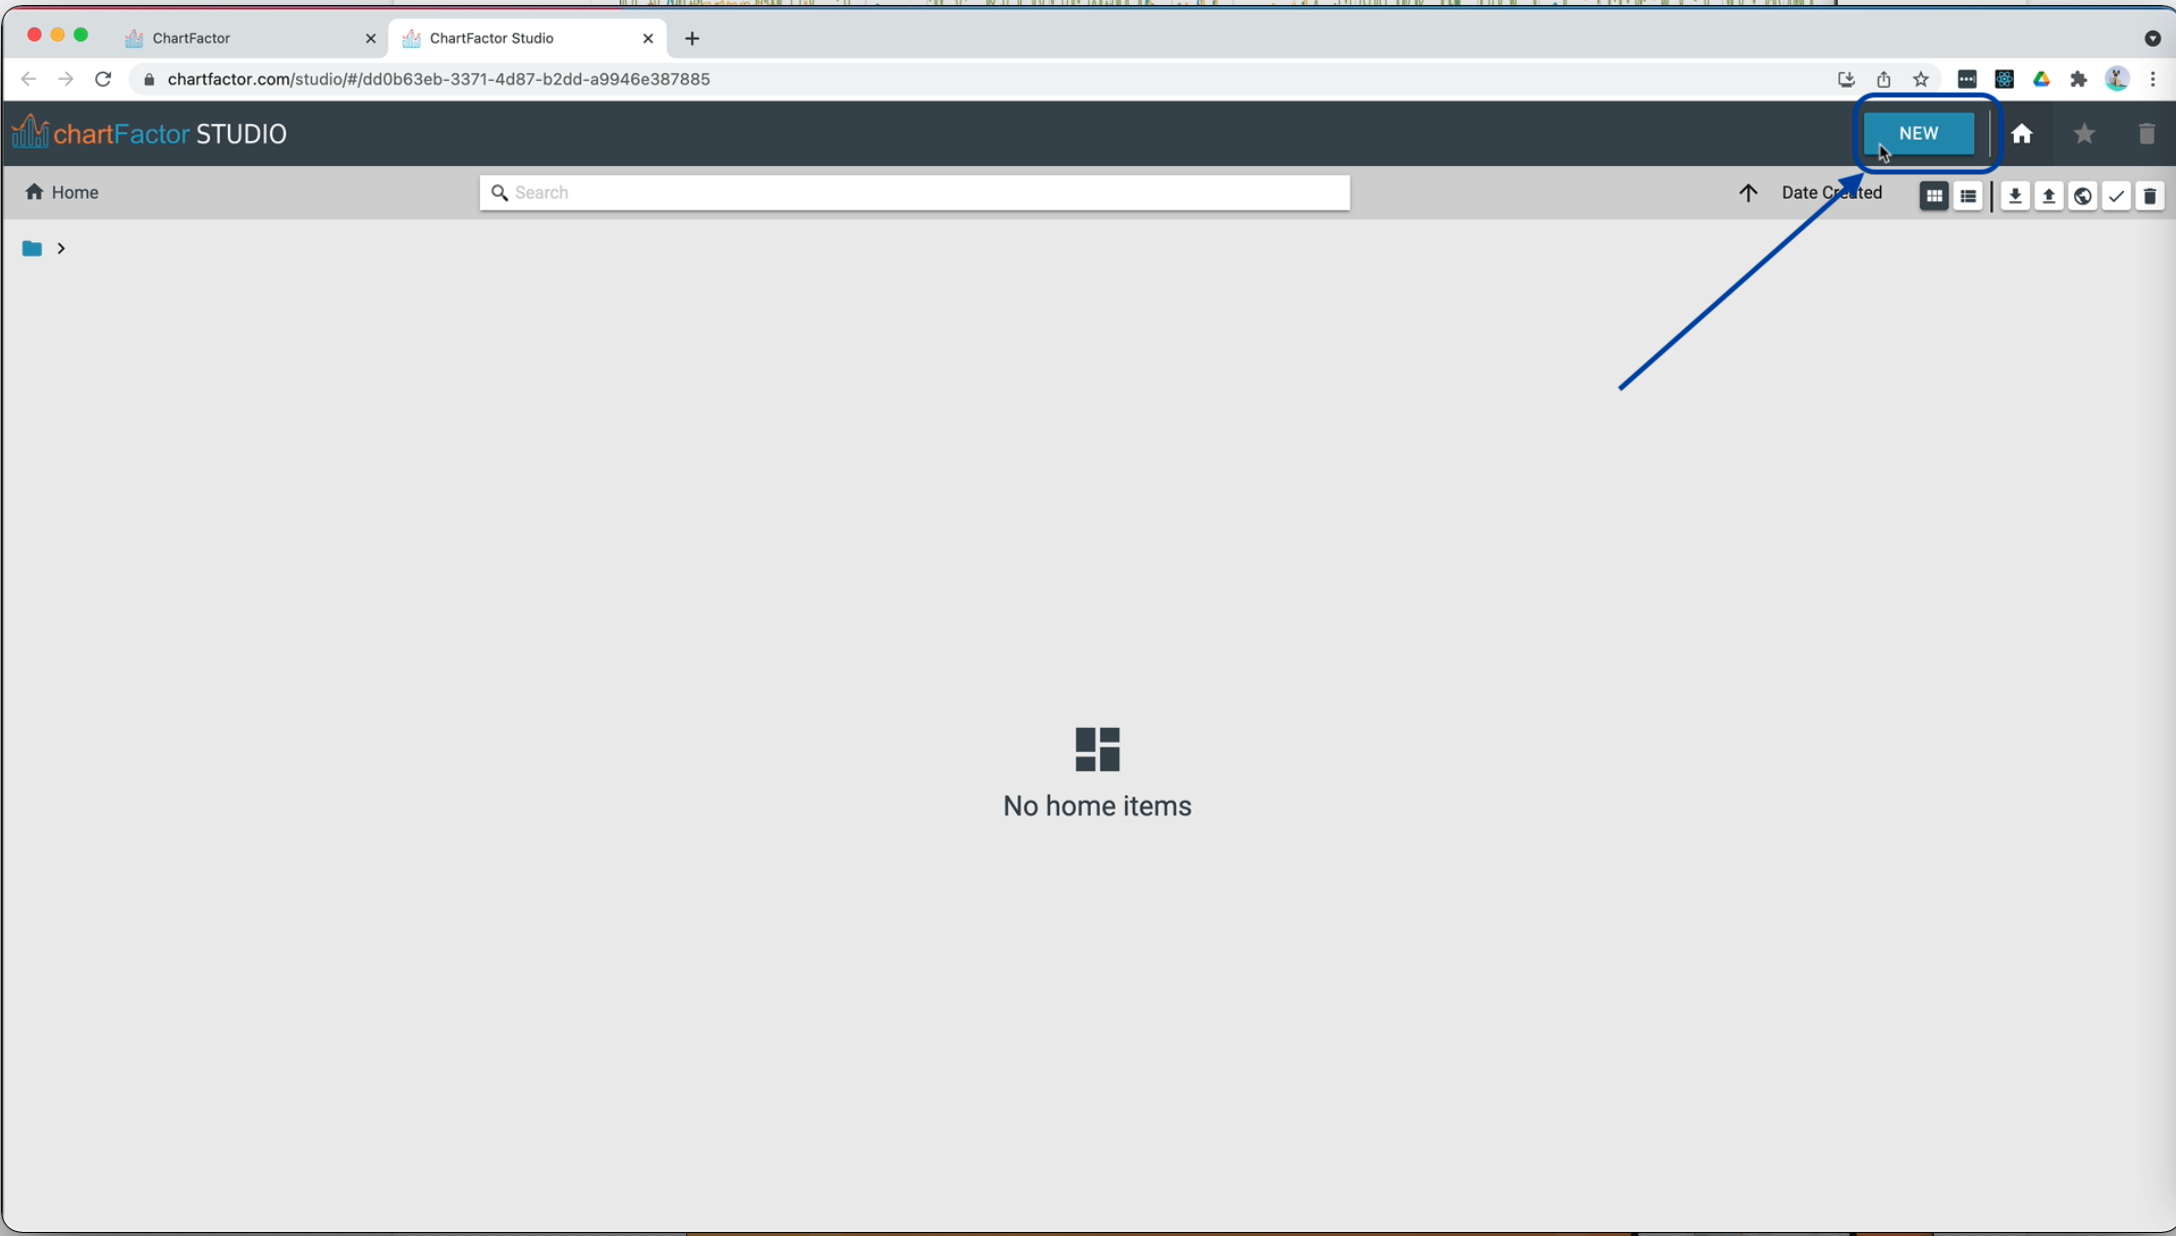
Click on the “New” button to create a new application
-
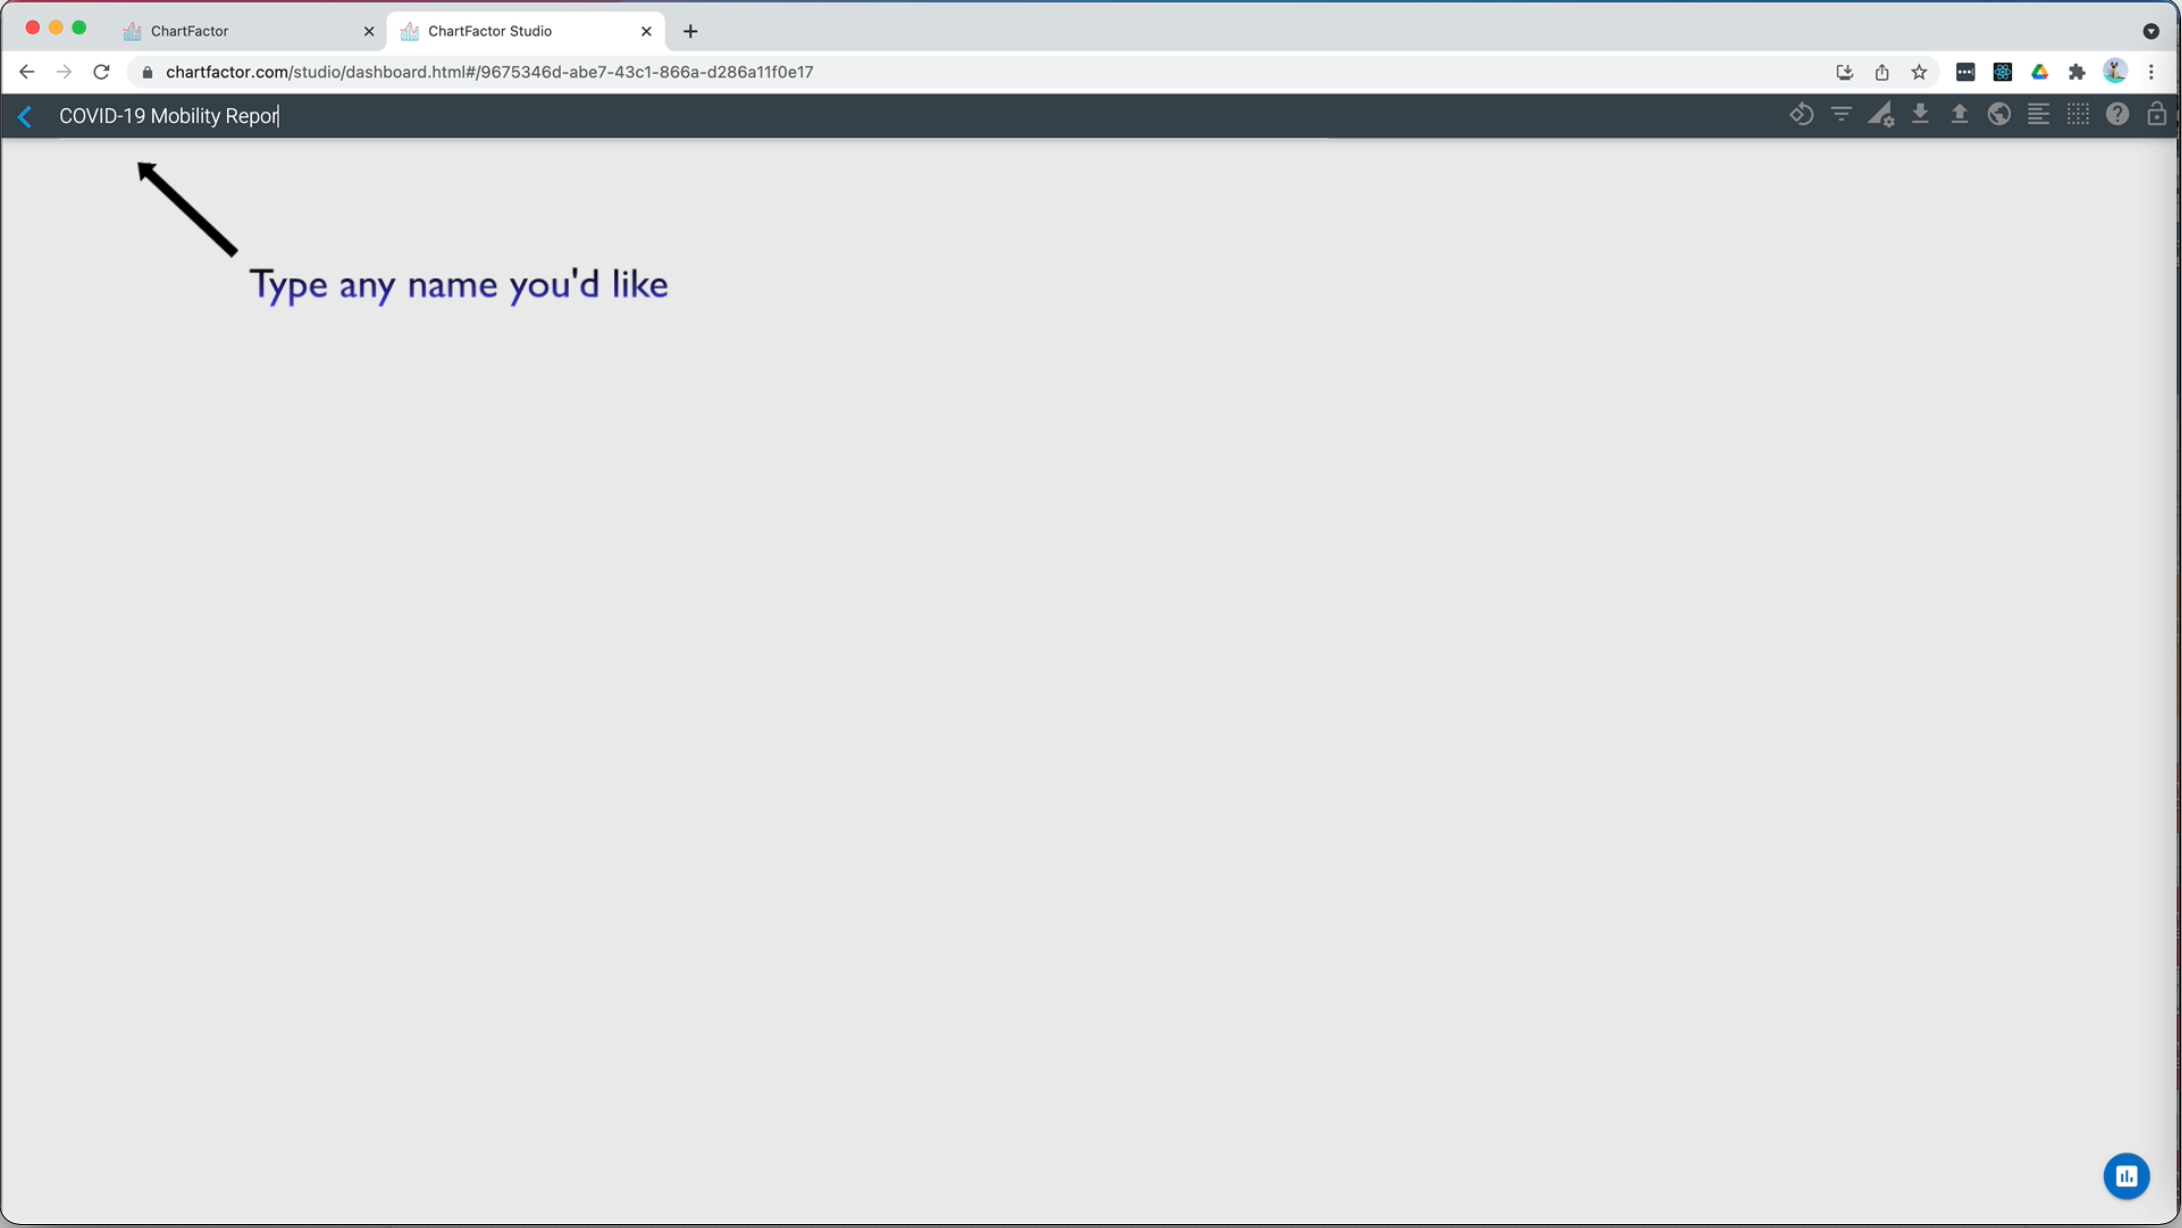
Type the name of your application. We are going to name it “COVID-19 Mobility Report”.
-
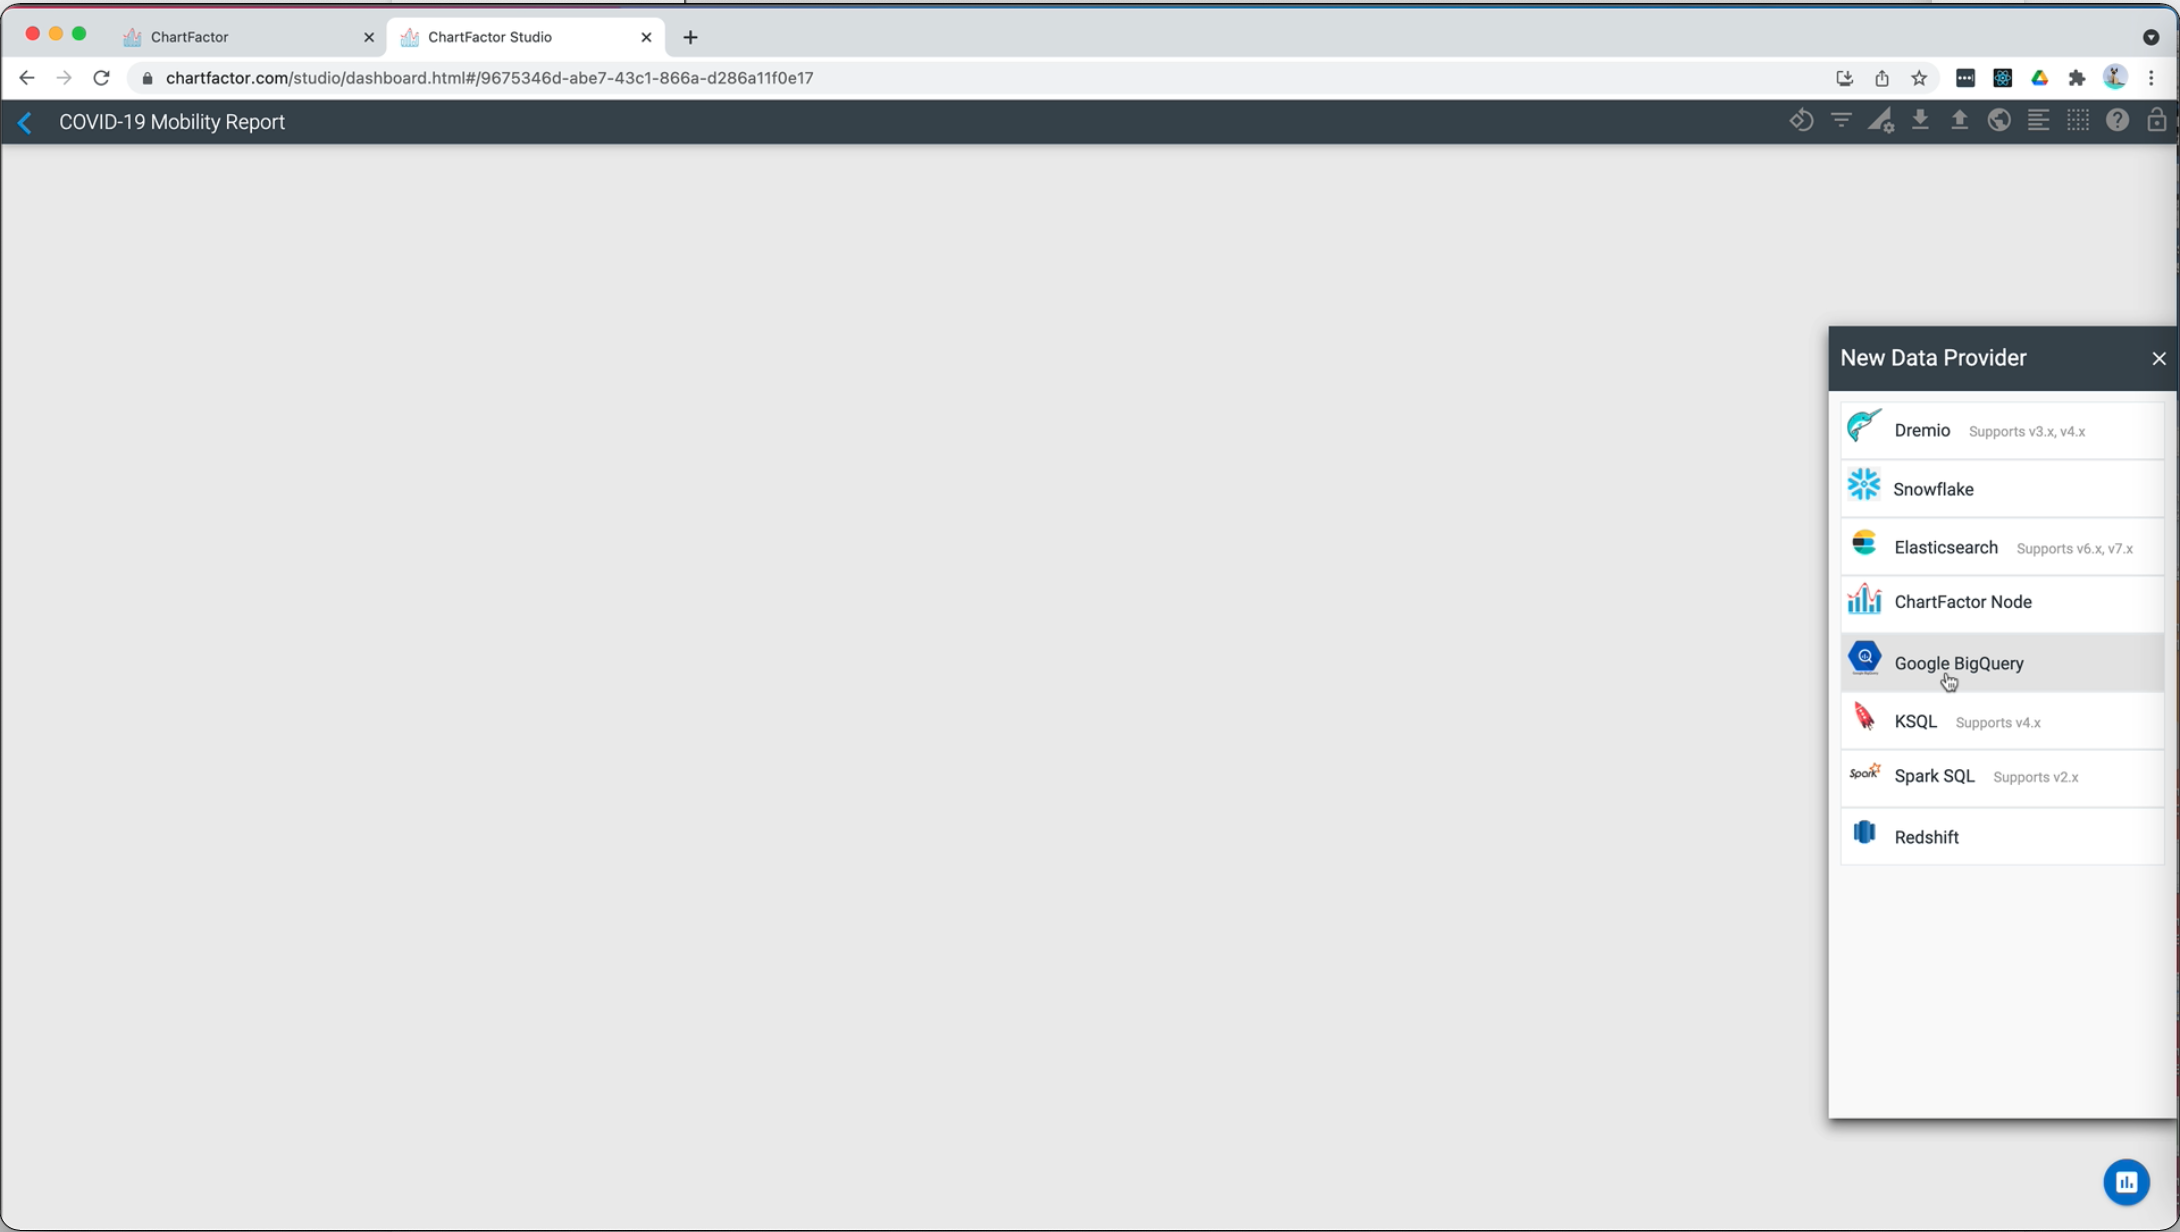
Set up a connection to your Google BigQuery data warehouse by selecting the lower-right blue button and selecting BigQuery.
-
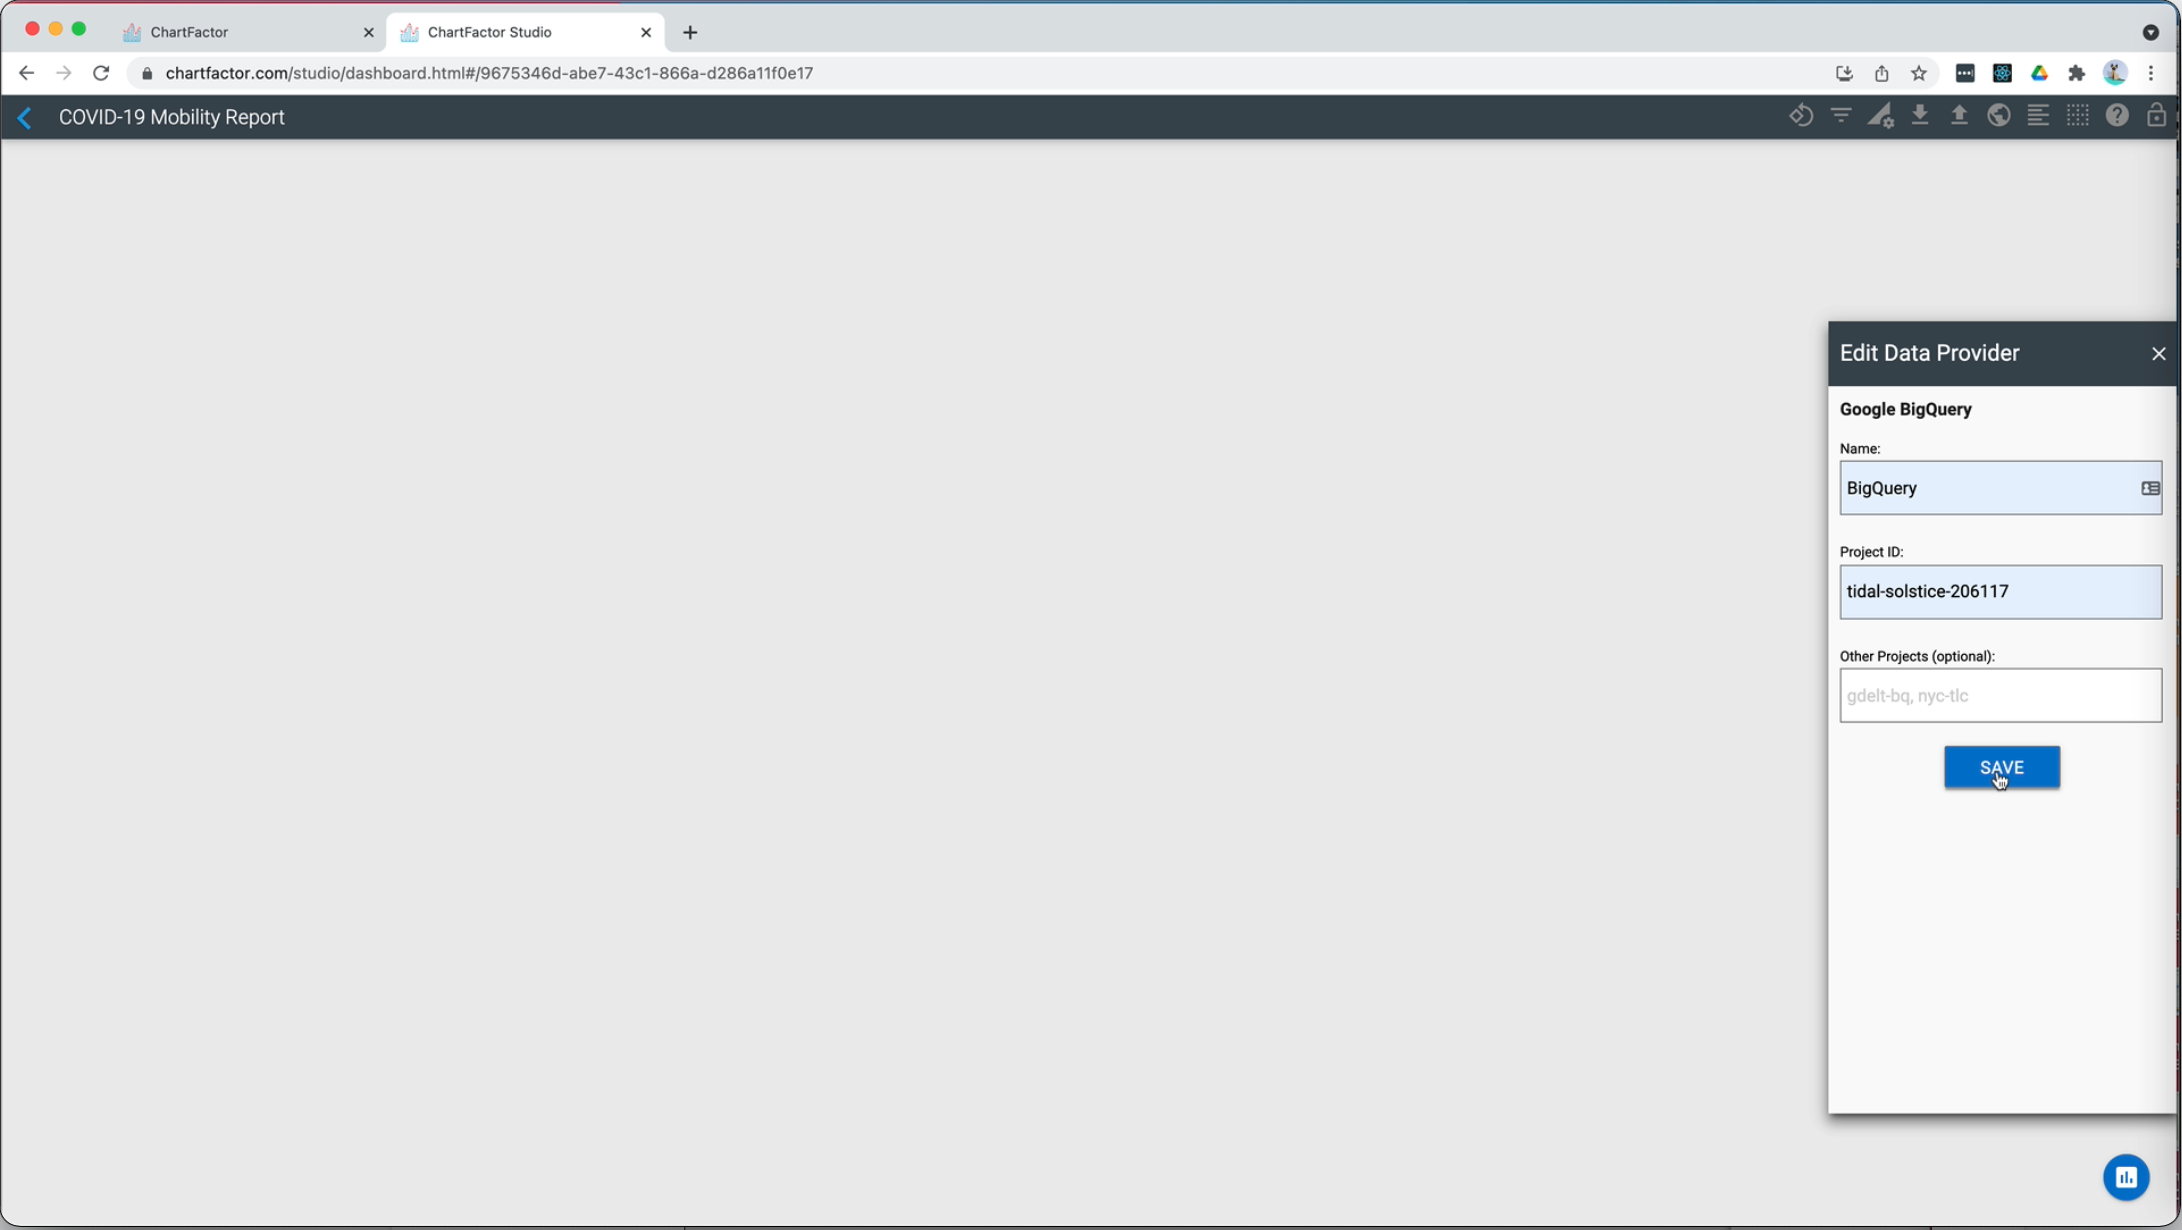
Type the data provider information:
- Name: any name that you’d like to use to identify your connection
- Project ID: This is the ID of your Google Cloud project. As mentioned earlier, if you don’t have a Google Cloud account, you can easily create your BigQuery account without a credit card.
Now, click on the “Save” button.
-
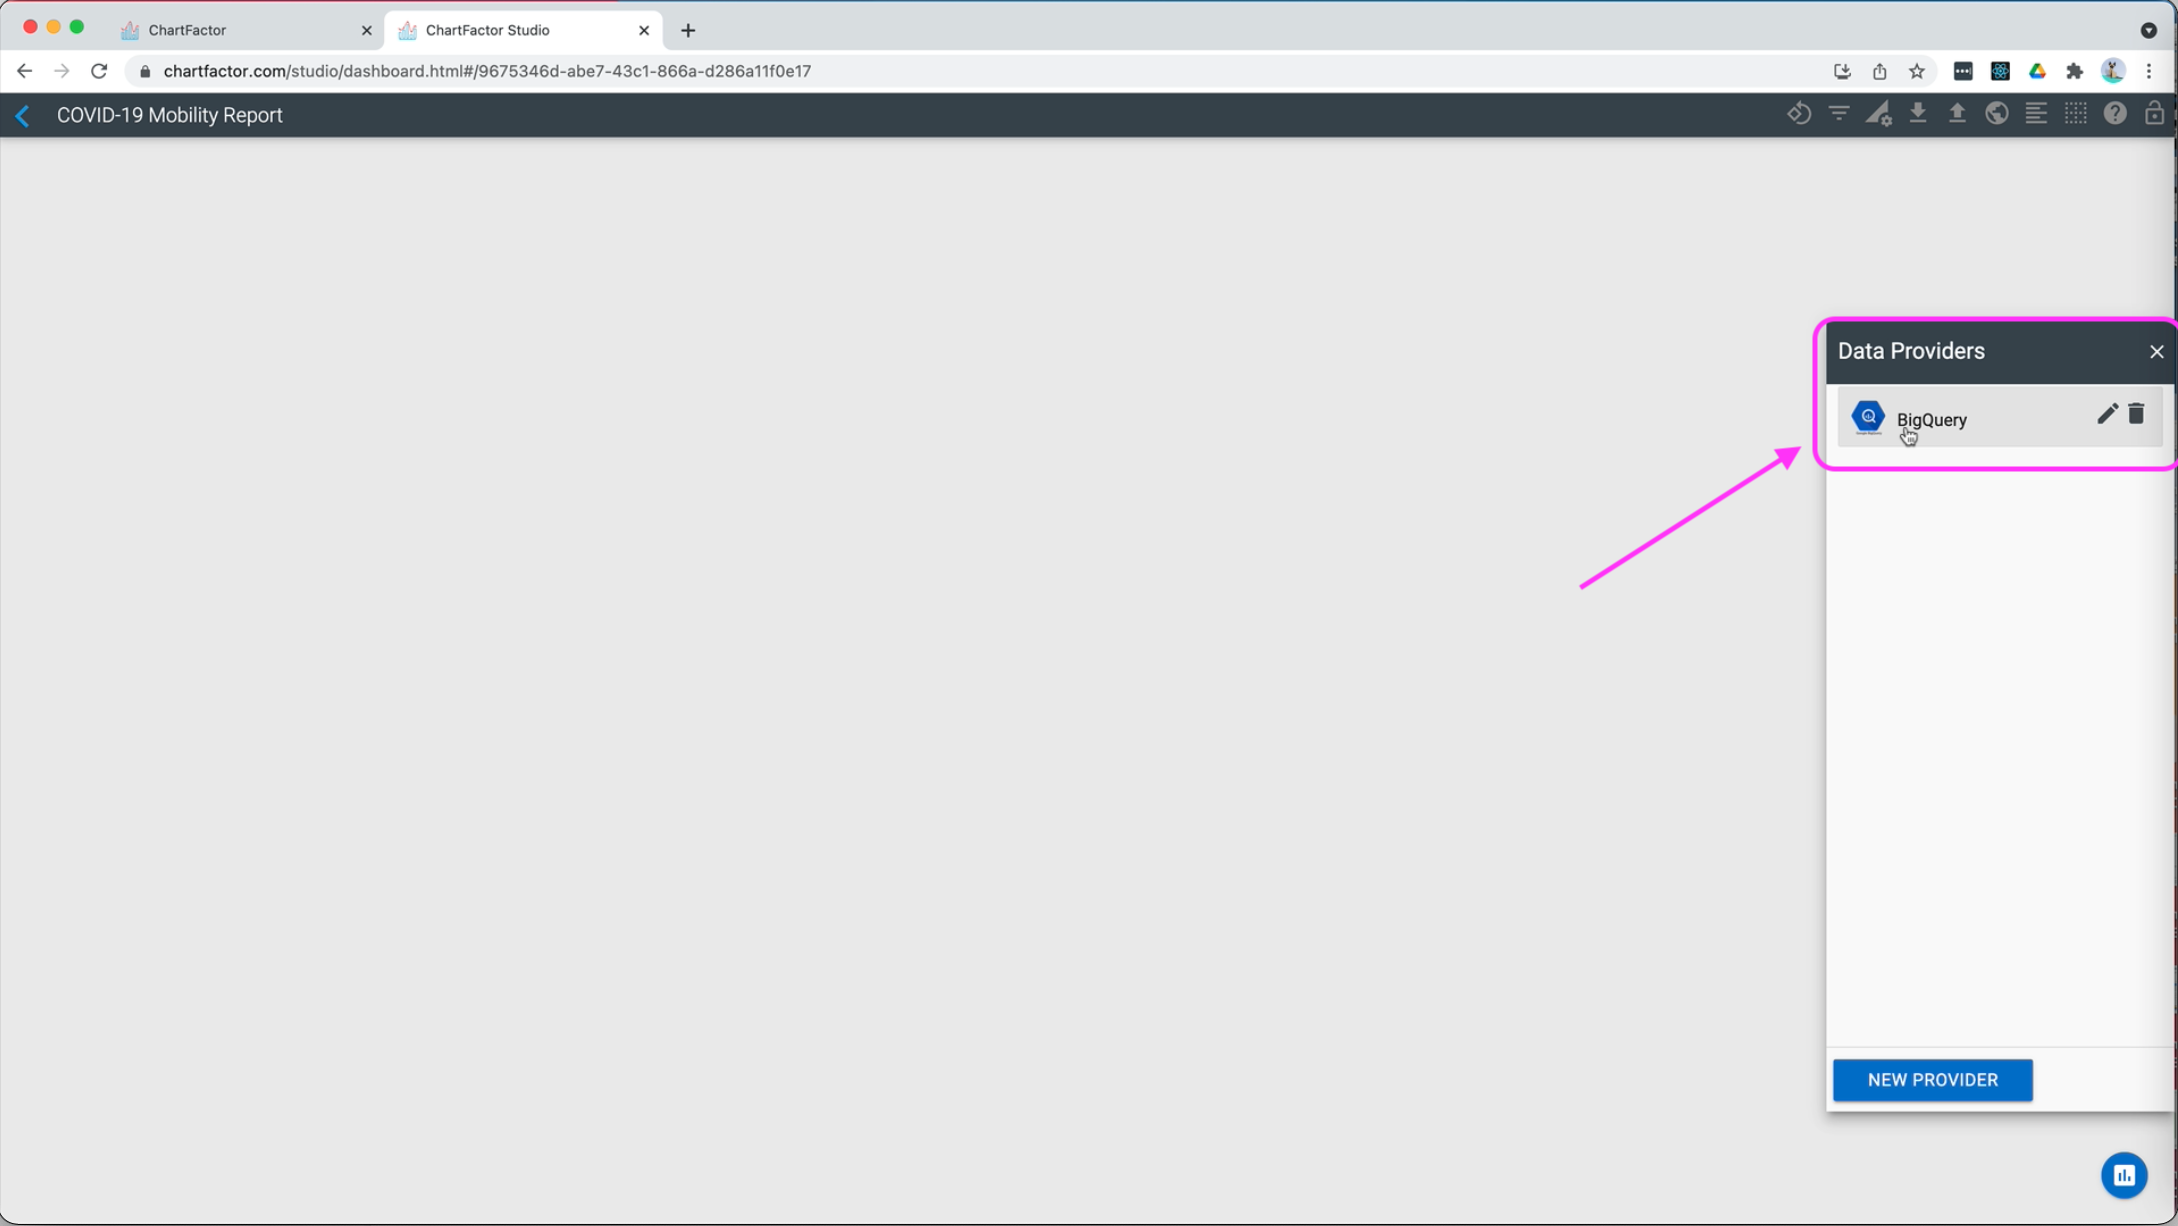
Select your BigQuery data provider you just created
-
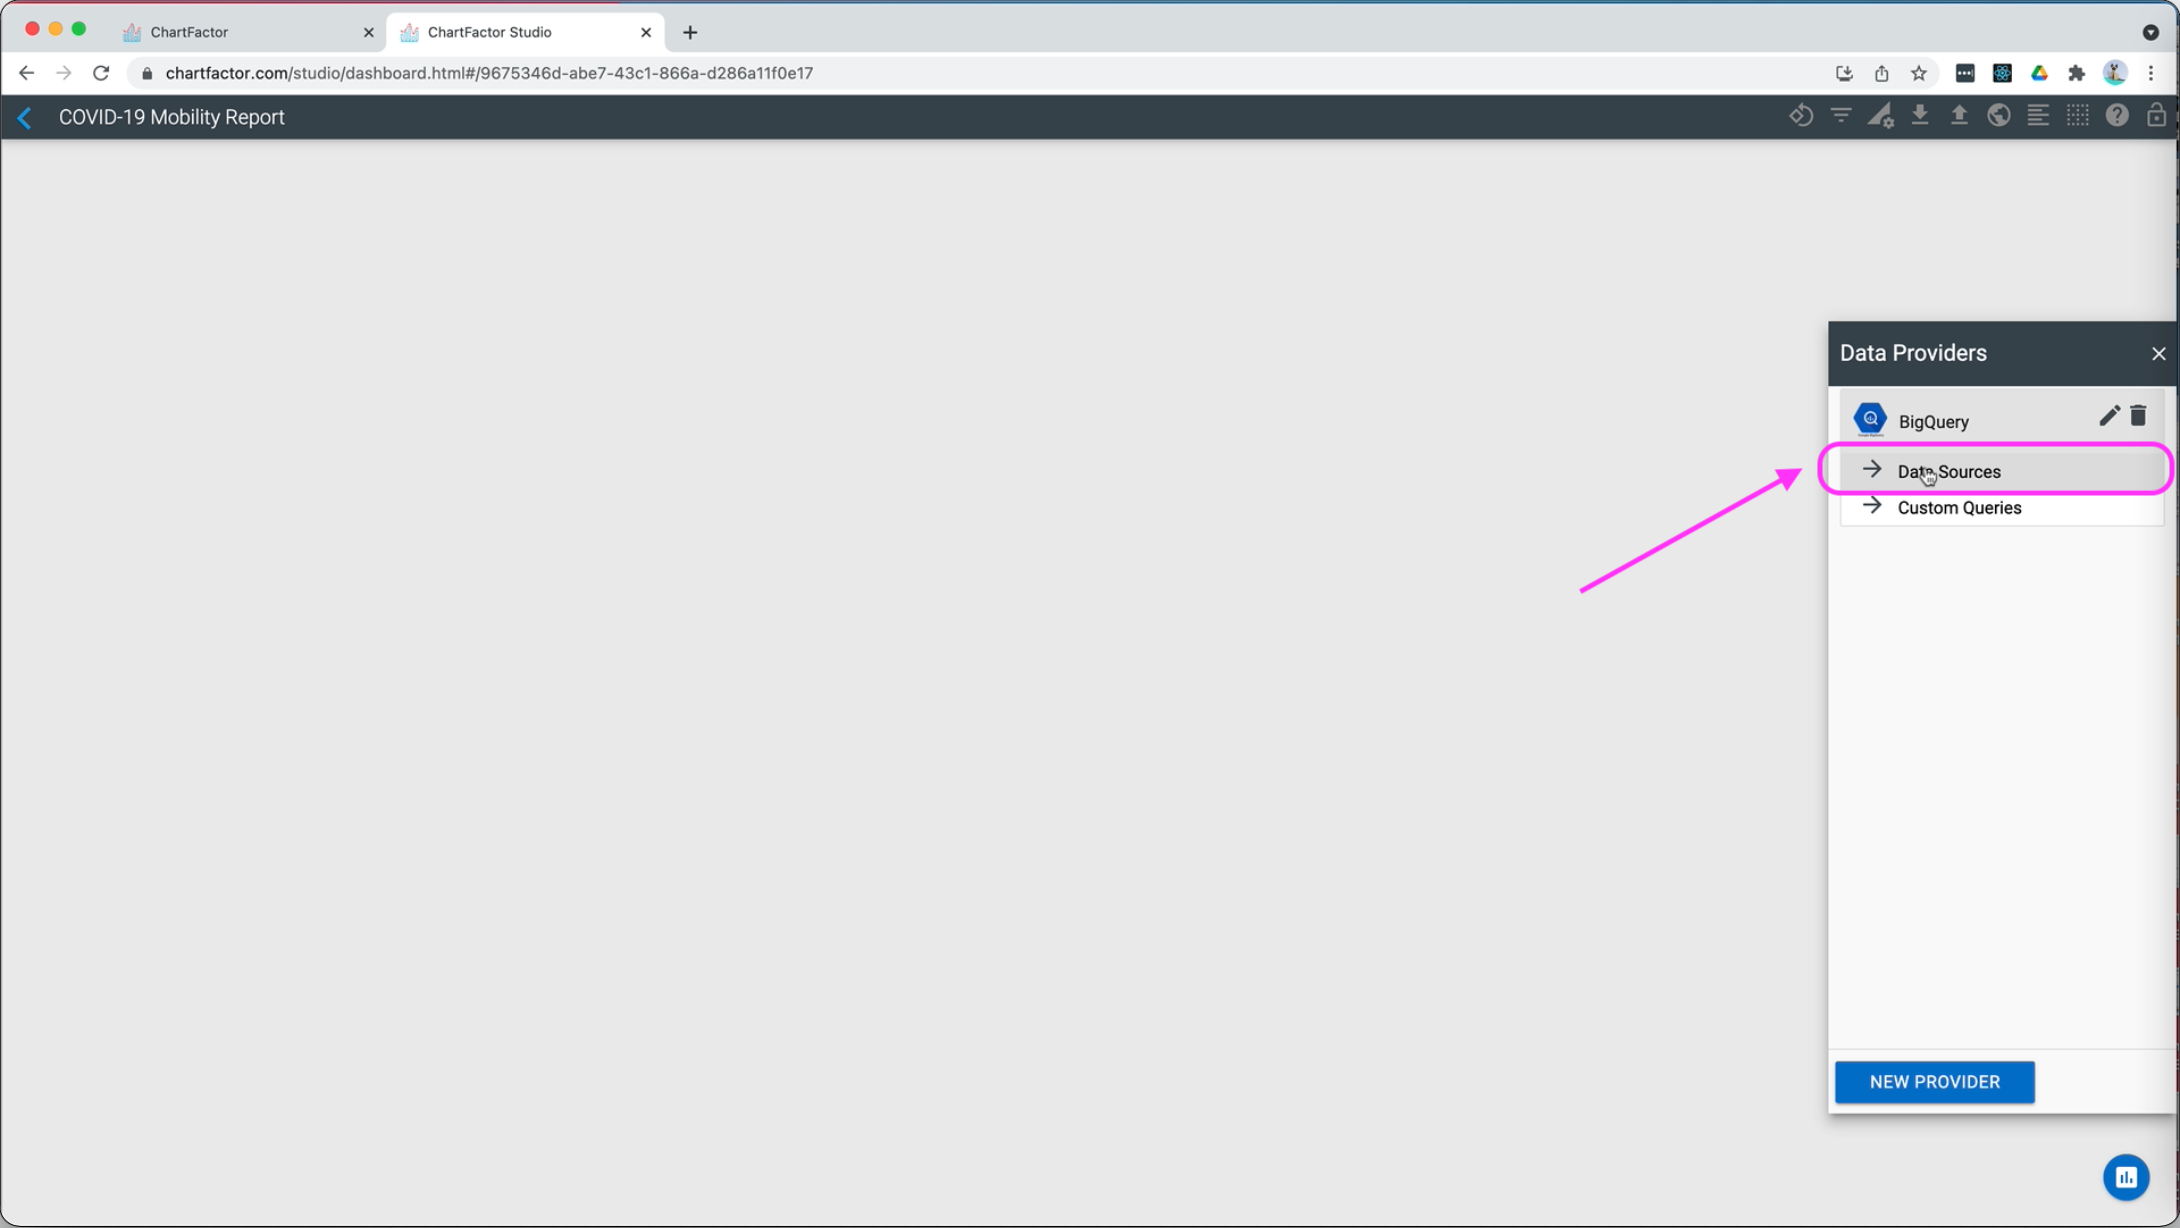
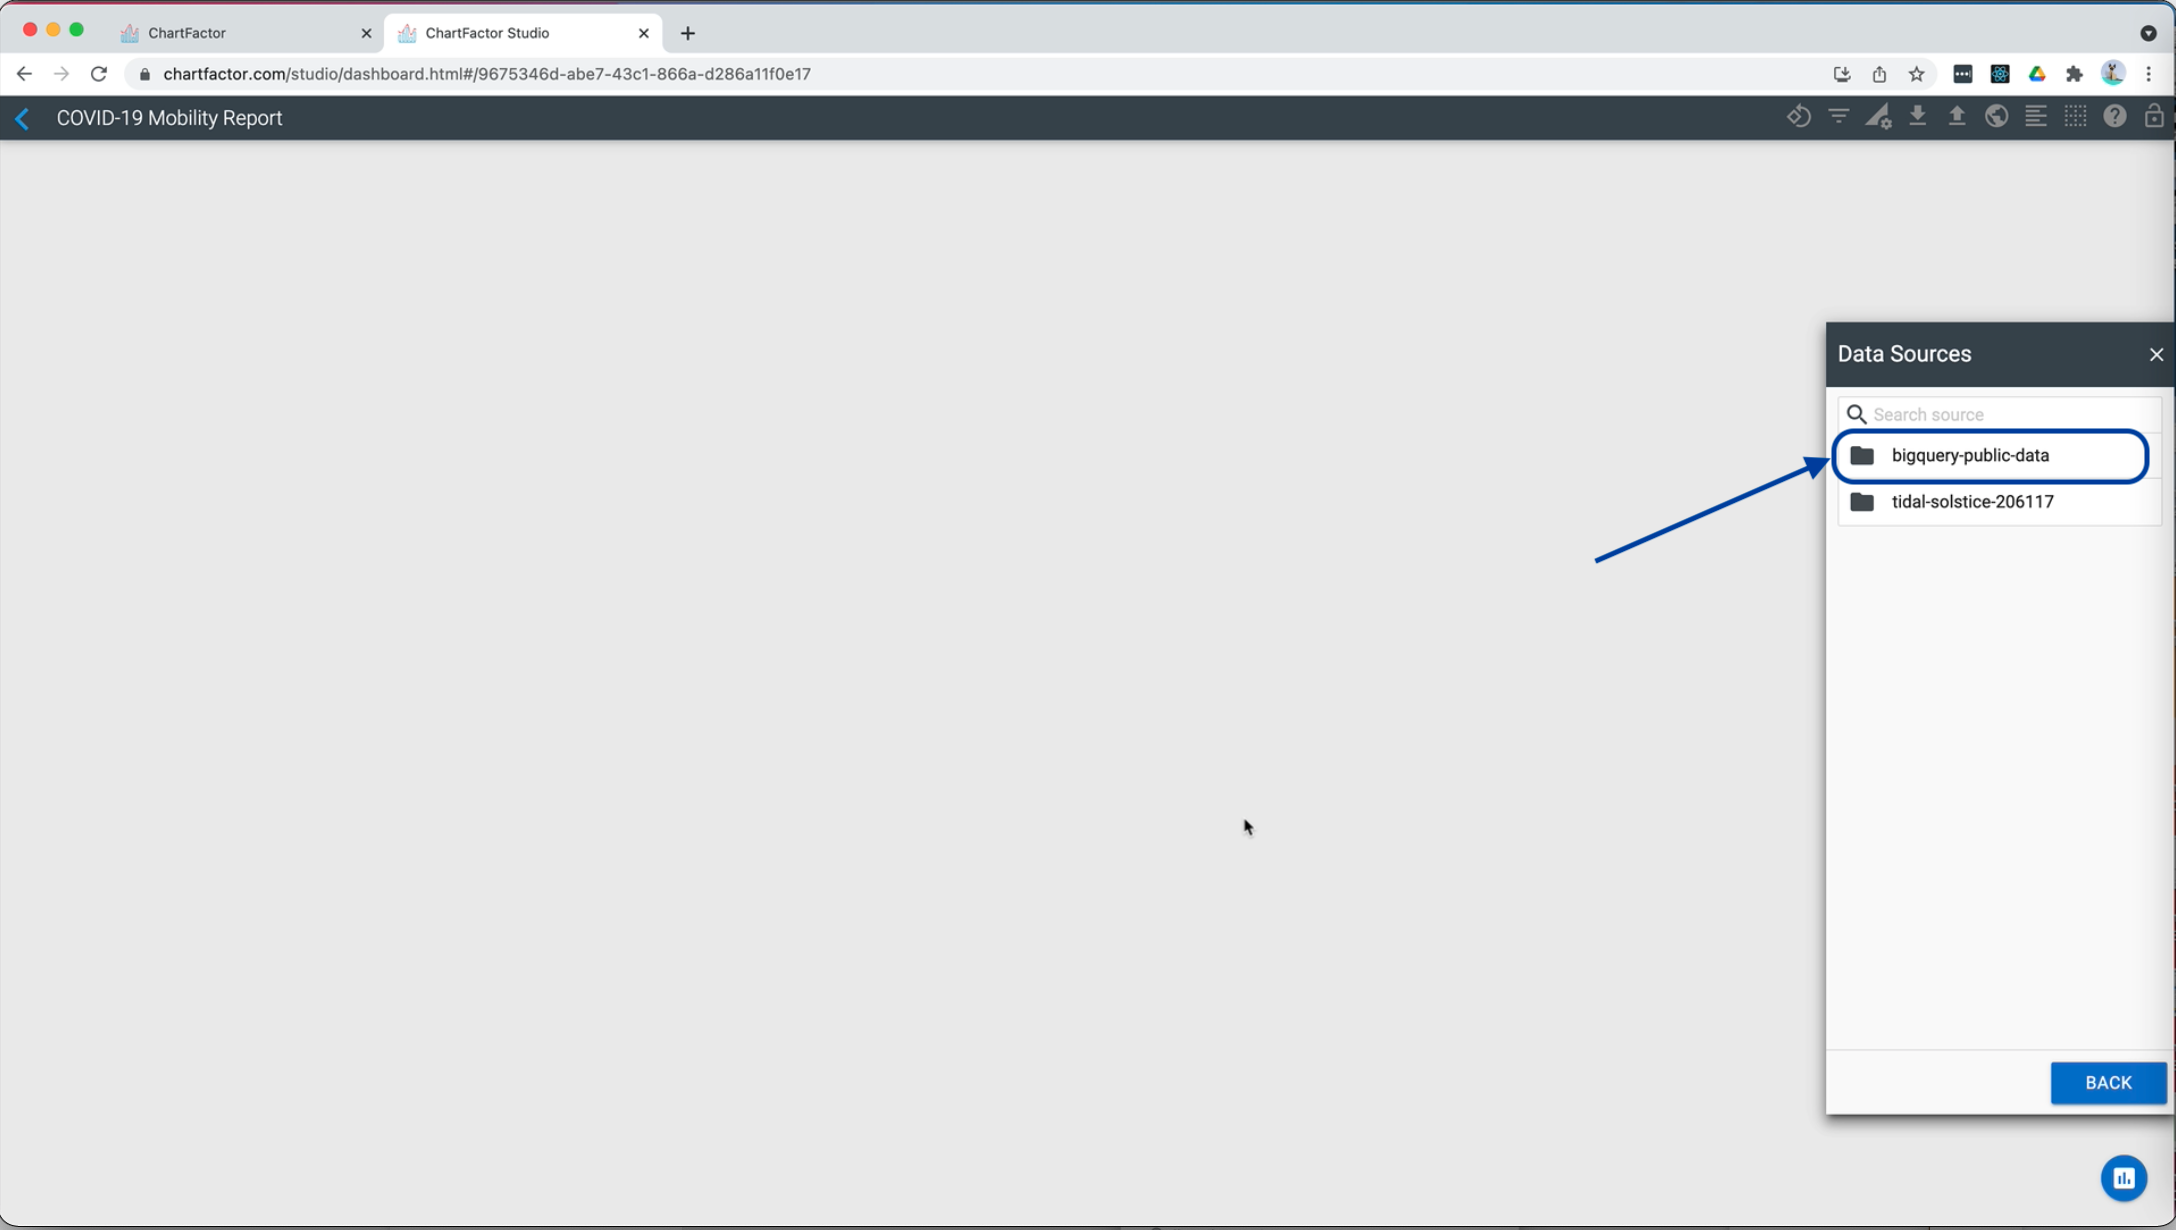
Select “Data Sources”
-
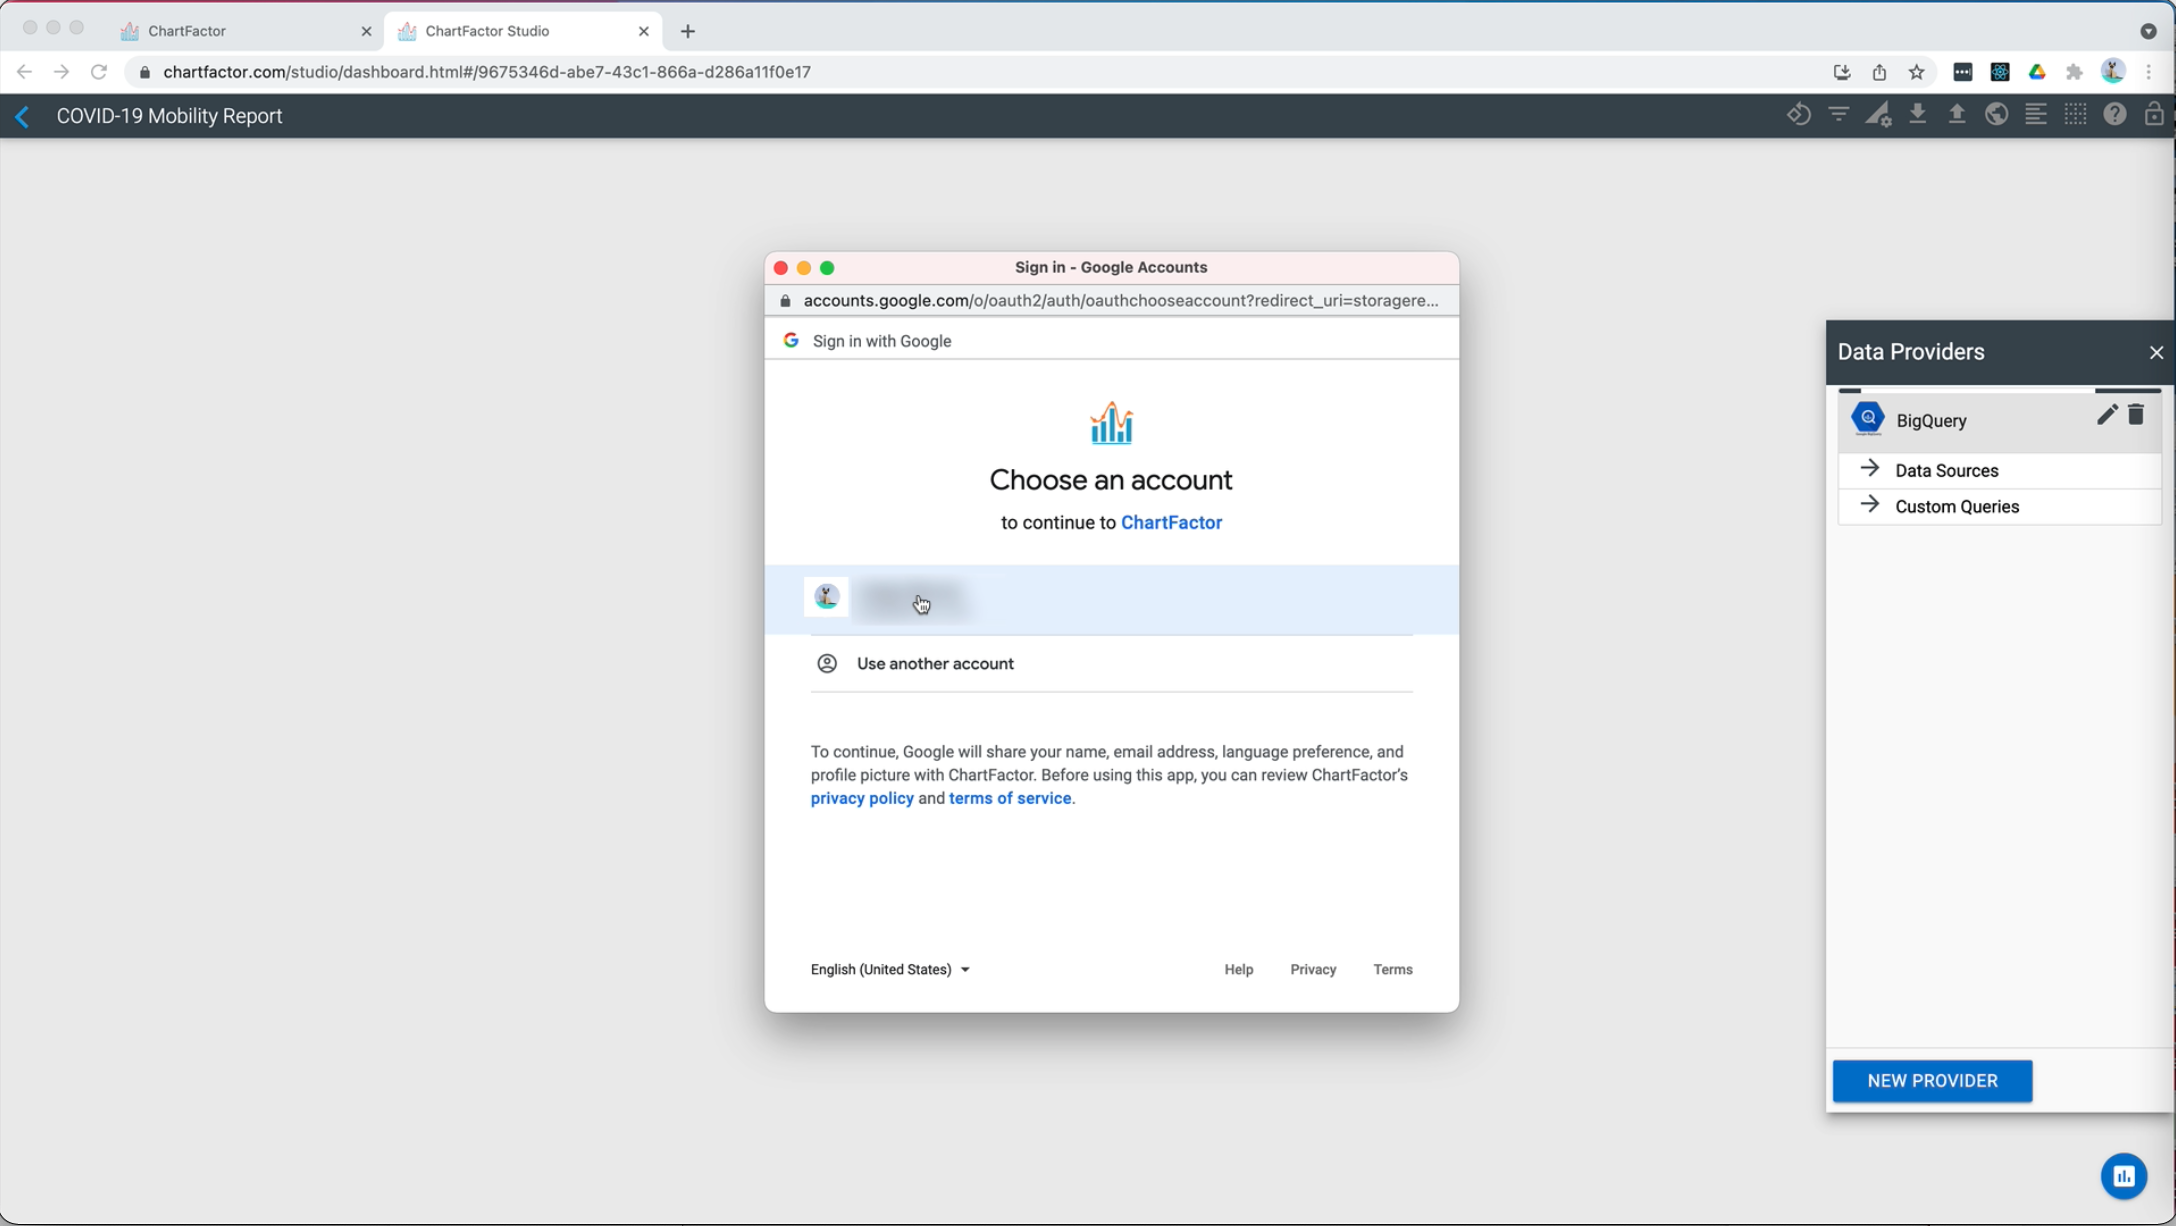
Now, you will authenticate to your Google Cloud account. Select your Google account to access your data and click on the “Allow” button. Note that ChartFactor Studio runs completely on your browser and only queries data that you need to see based on your navigation.
-
Select the “bigquery-public-data” project
-
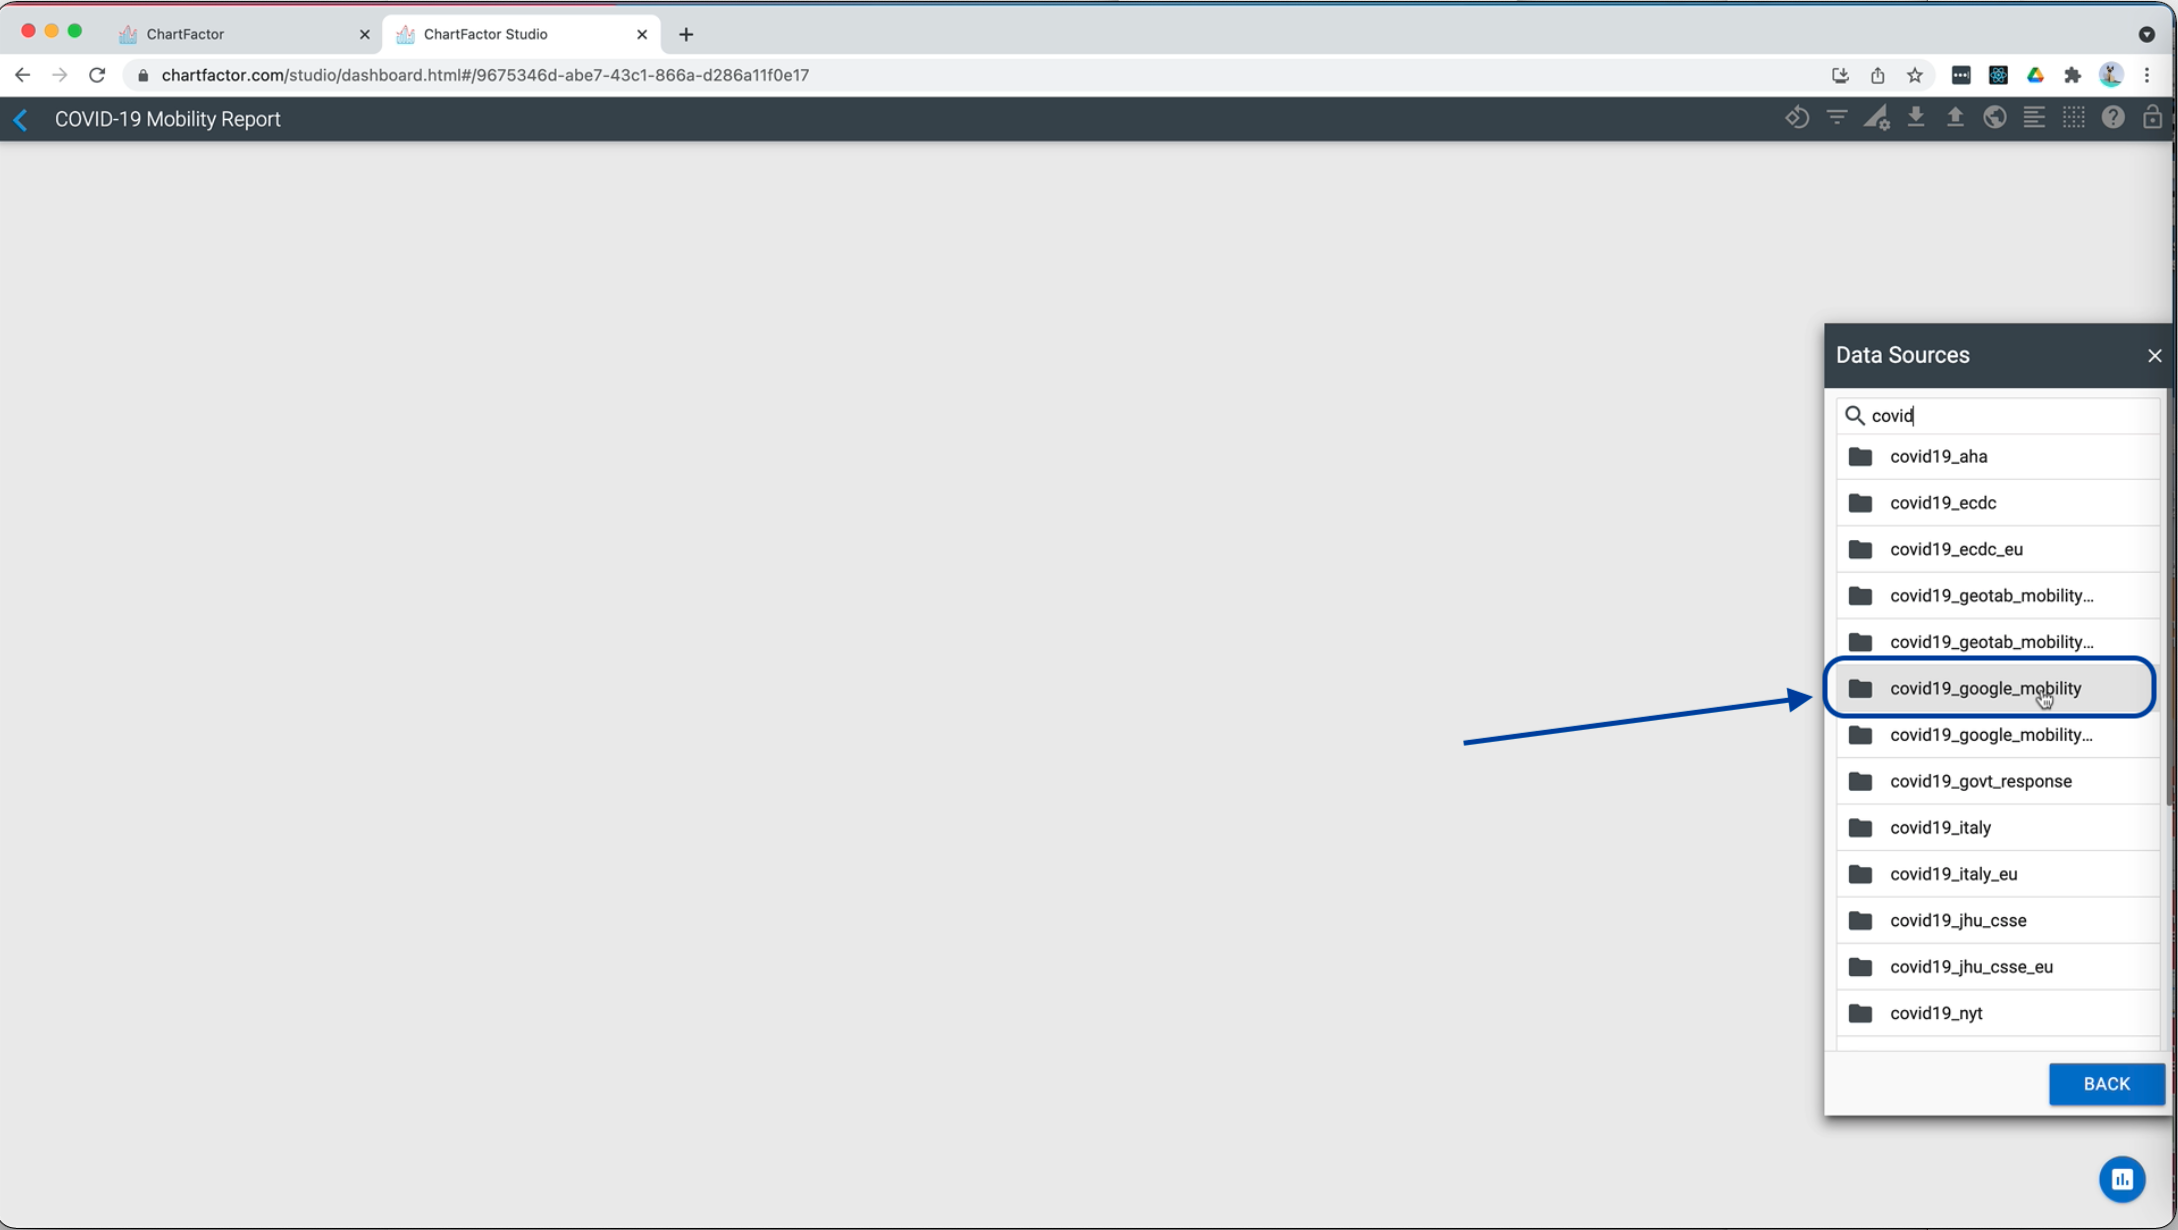
Look for the “covid19_google_mobility” dataset and select it
-
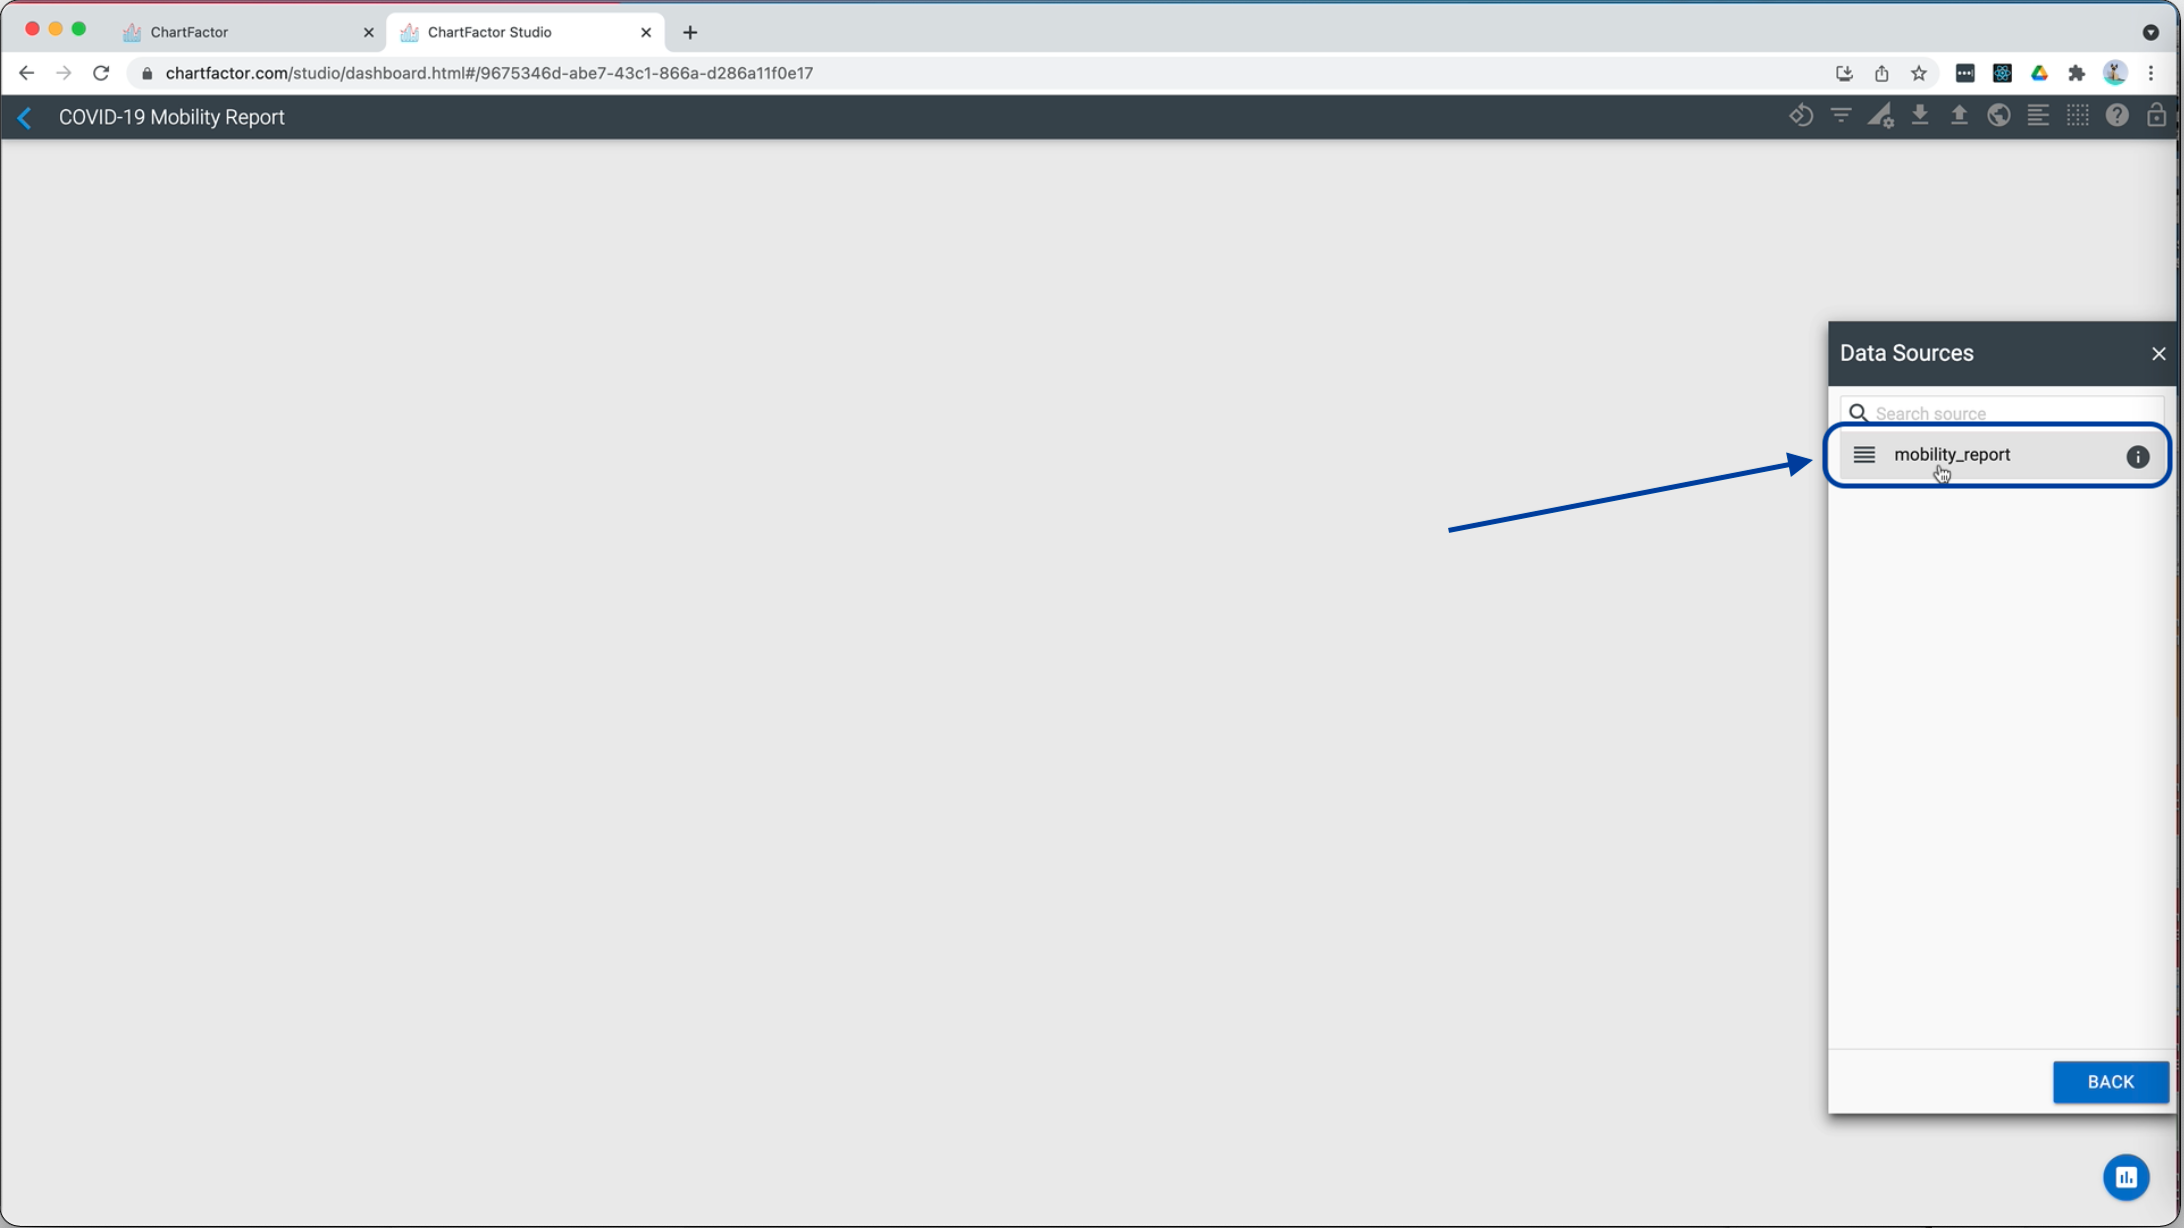
Select the “mobility_report” table
-
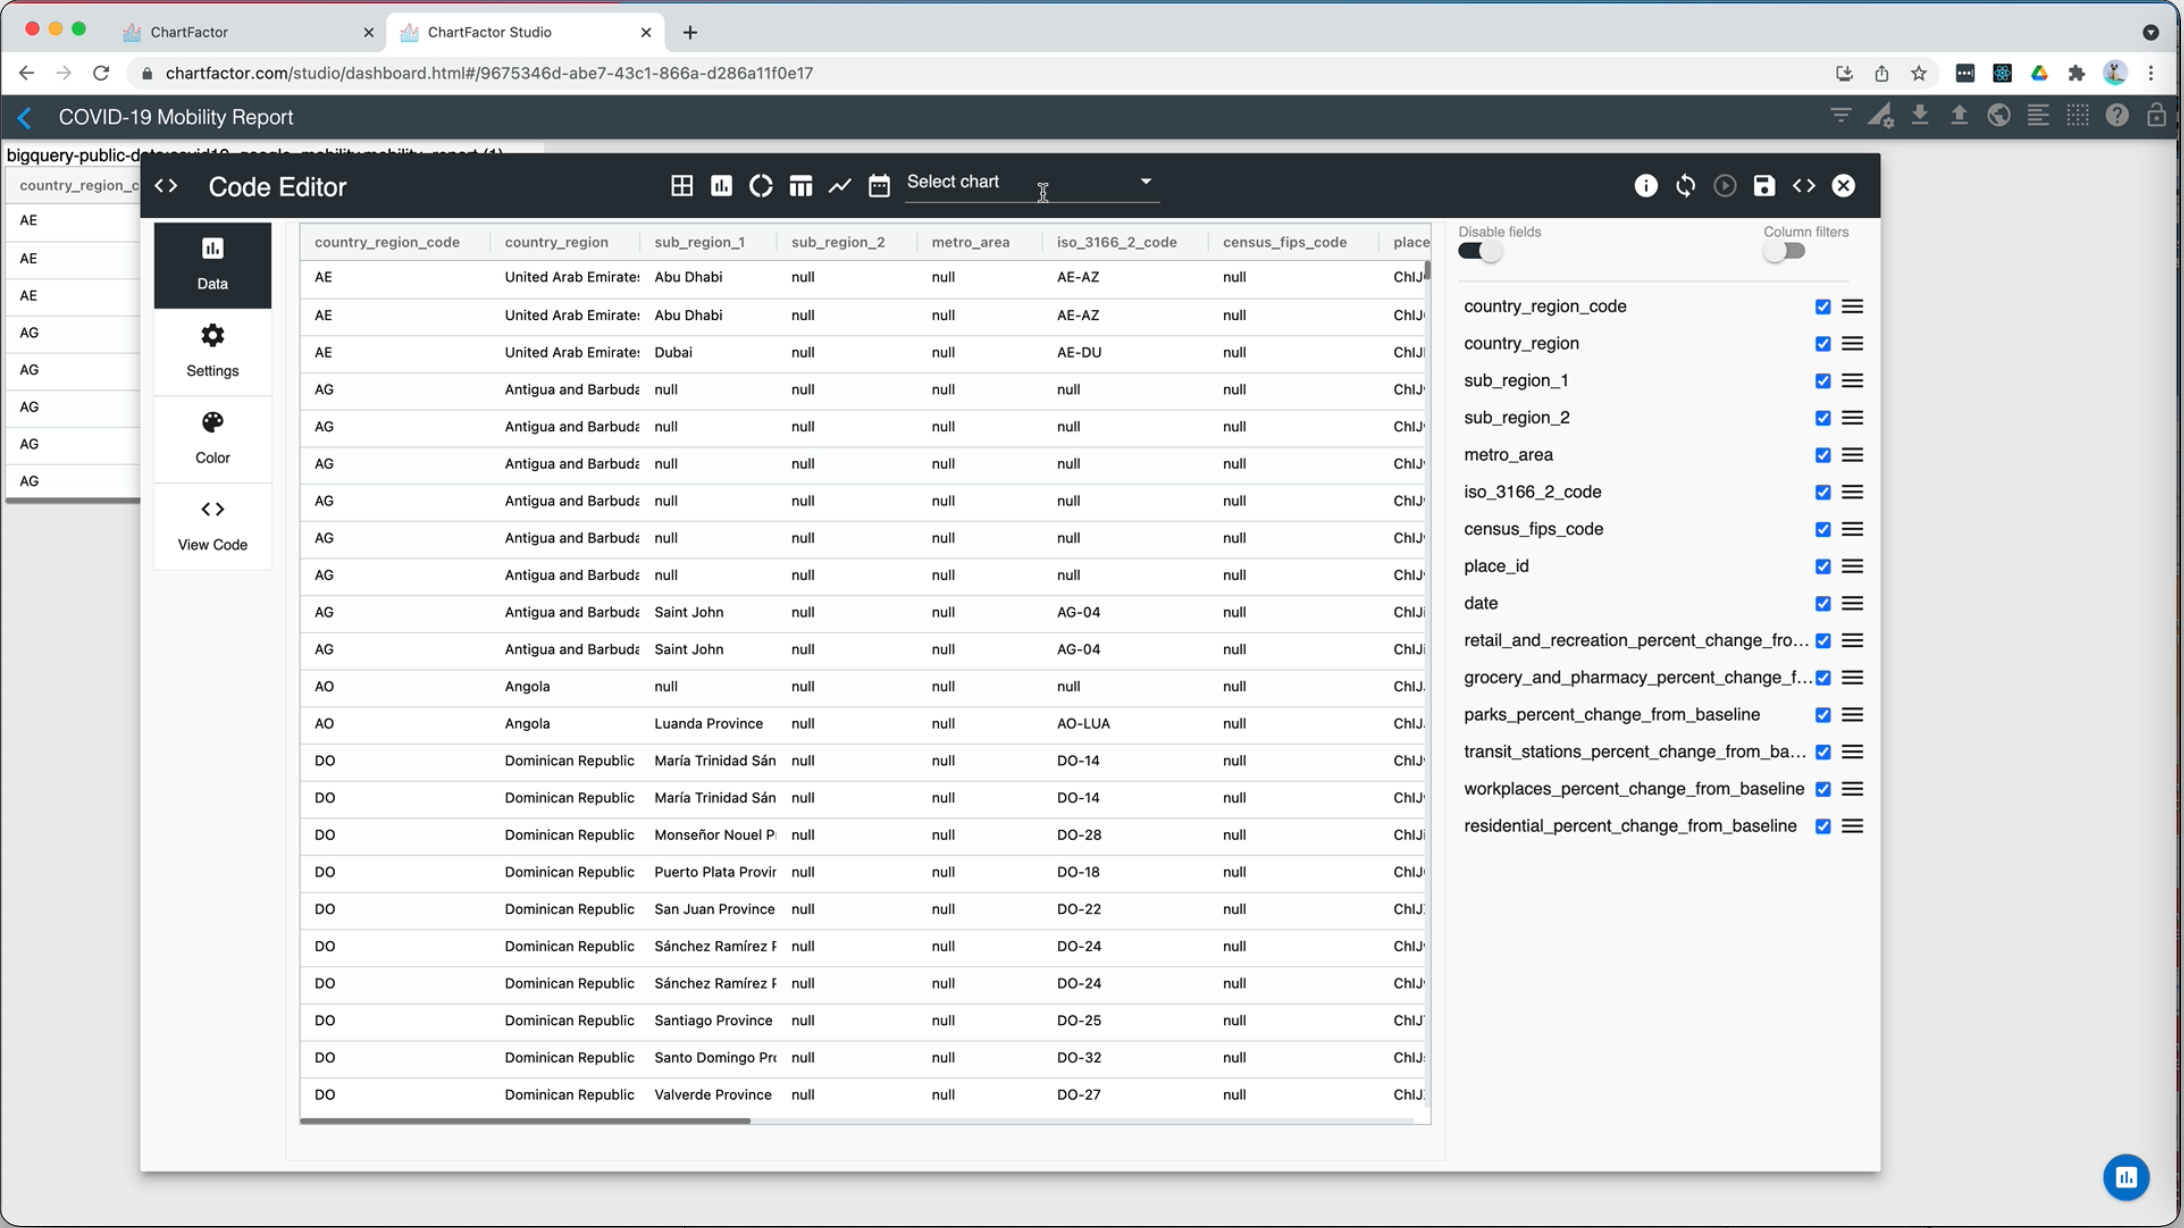
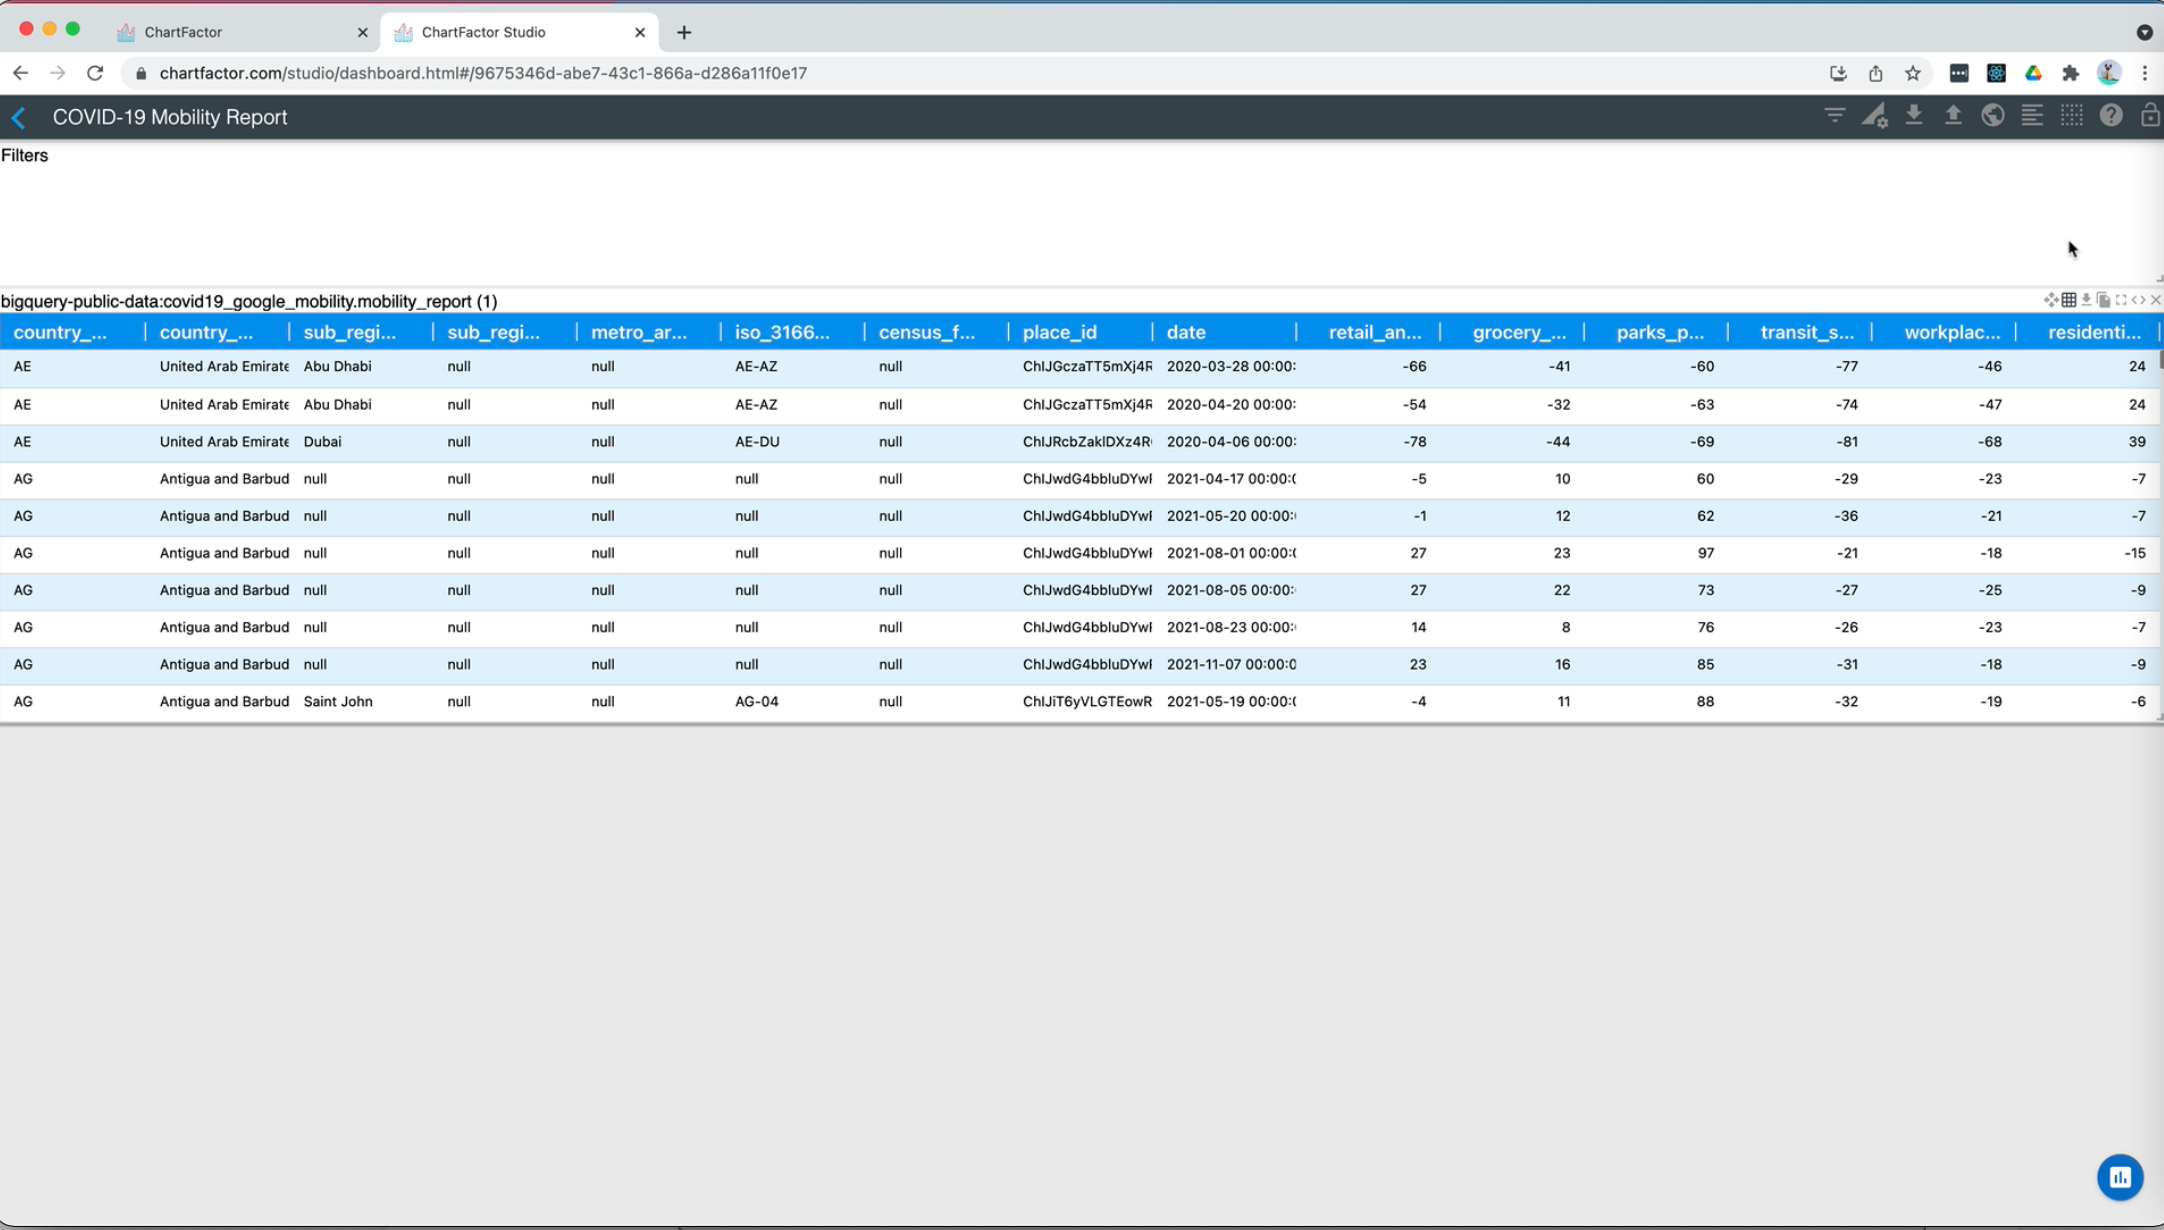
Now you should see the table selected as shown below
-
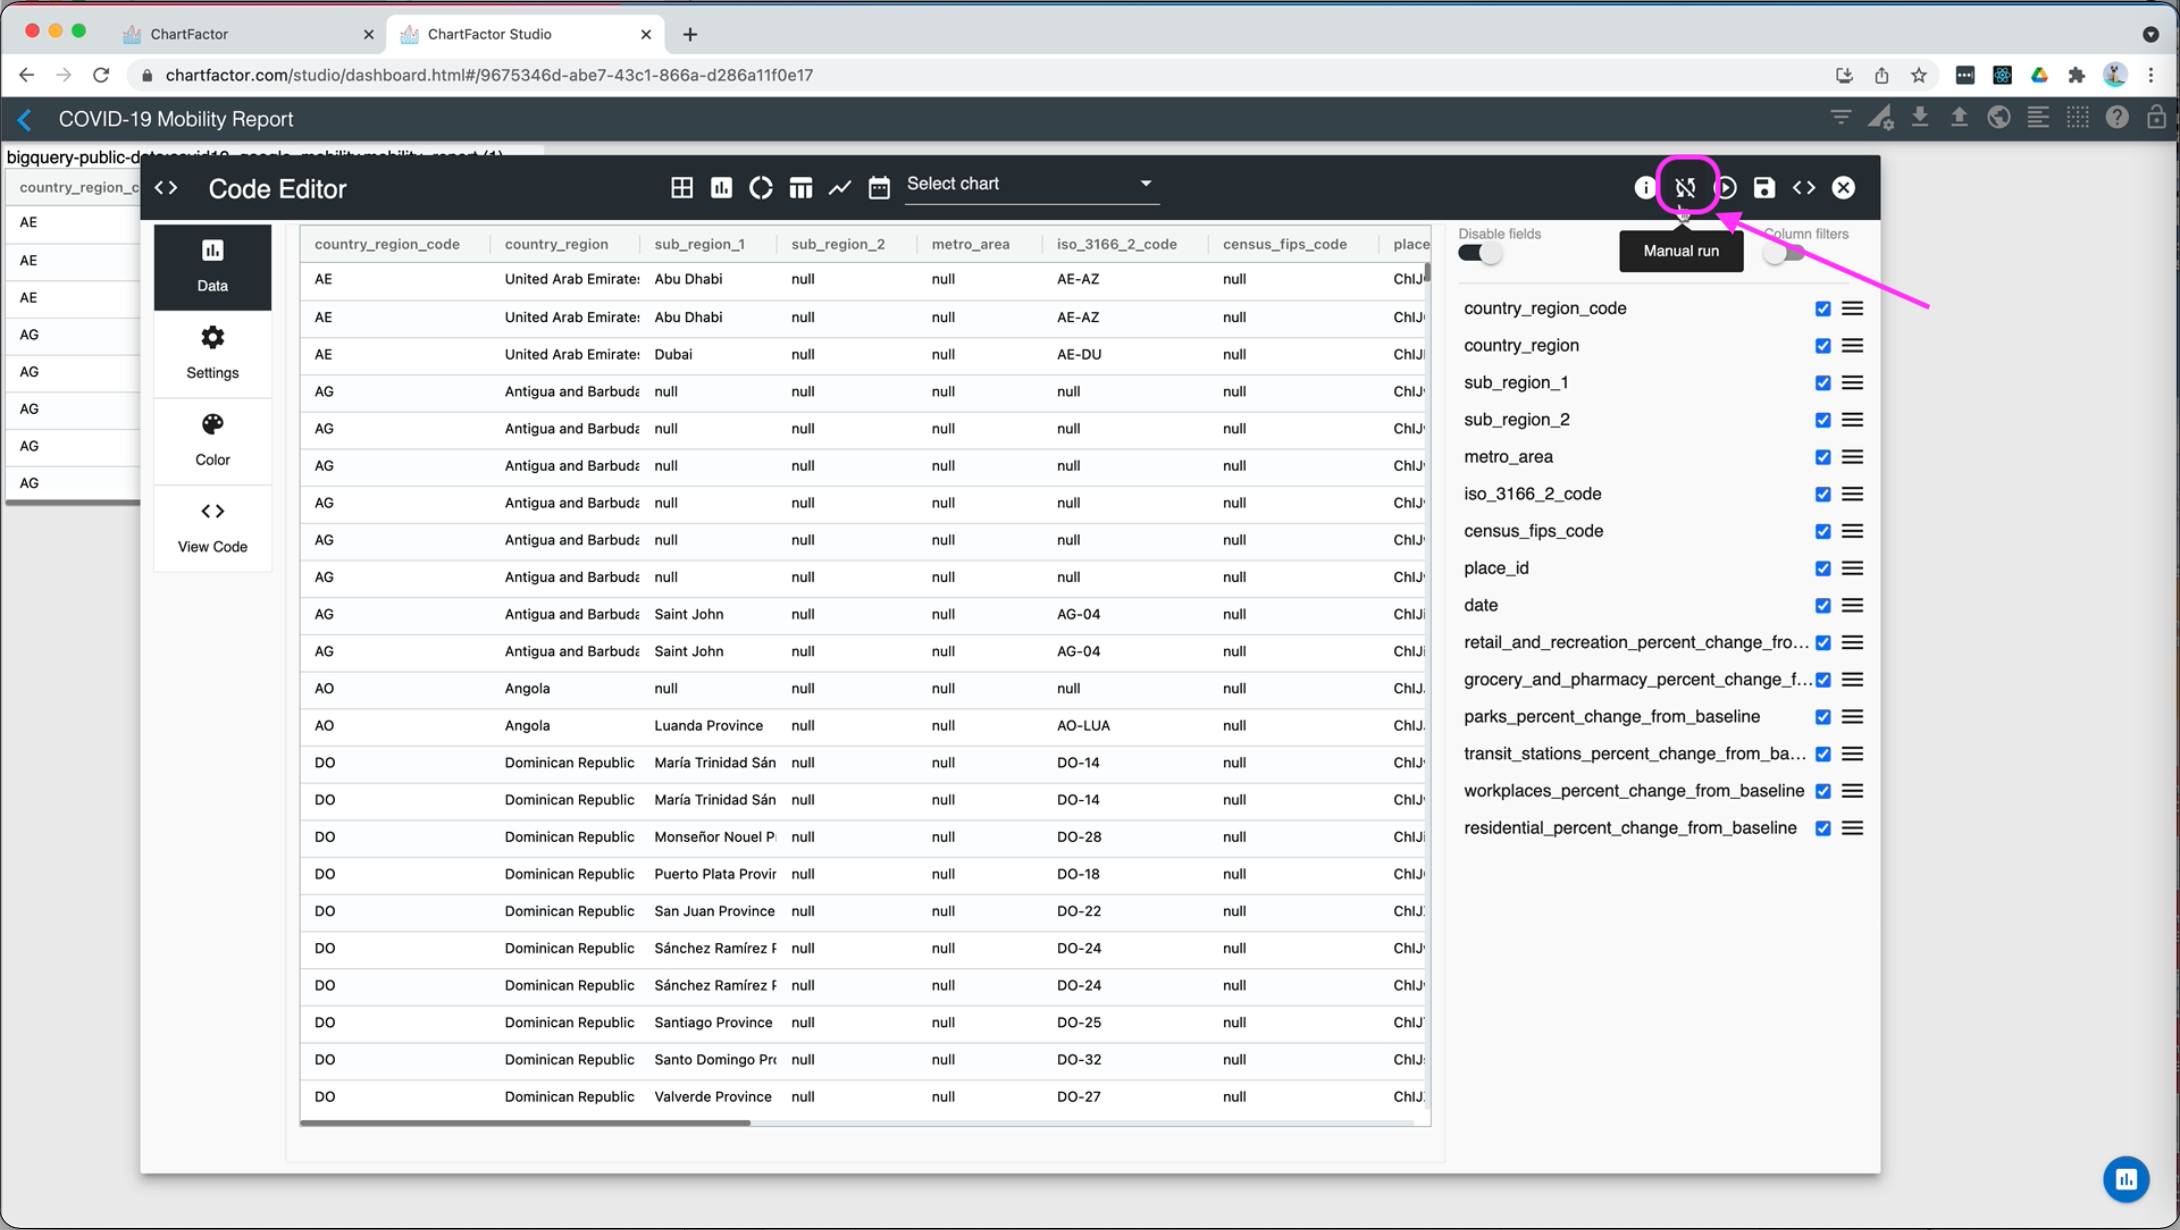
Switch Studio to manual run to execute queries only after we are done with all settings
-
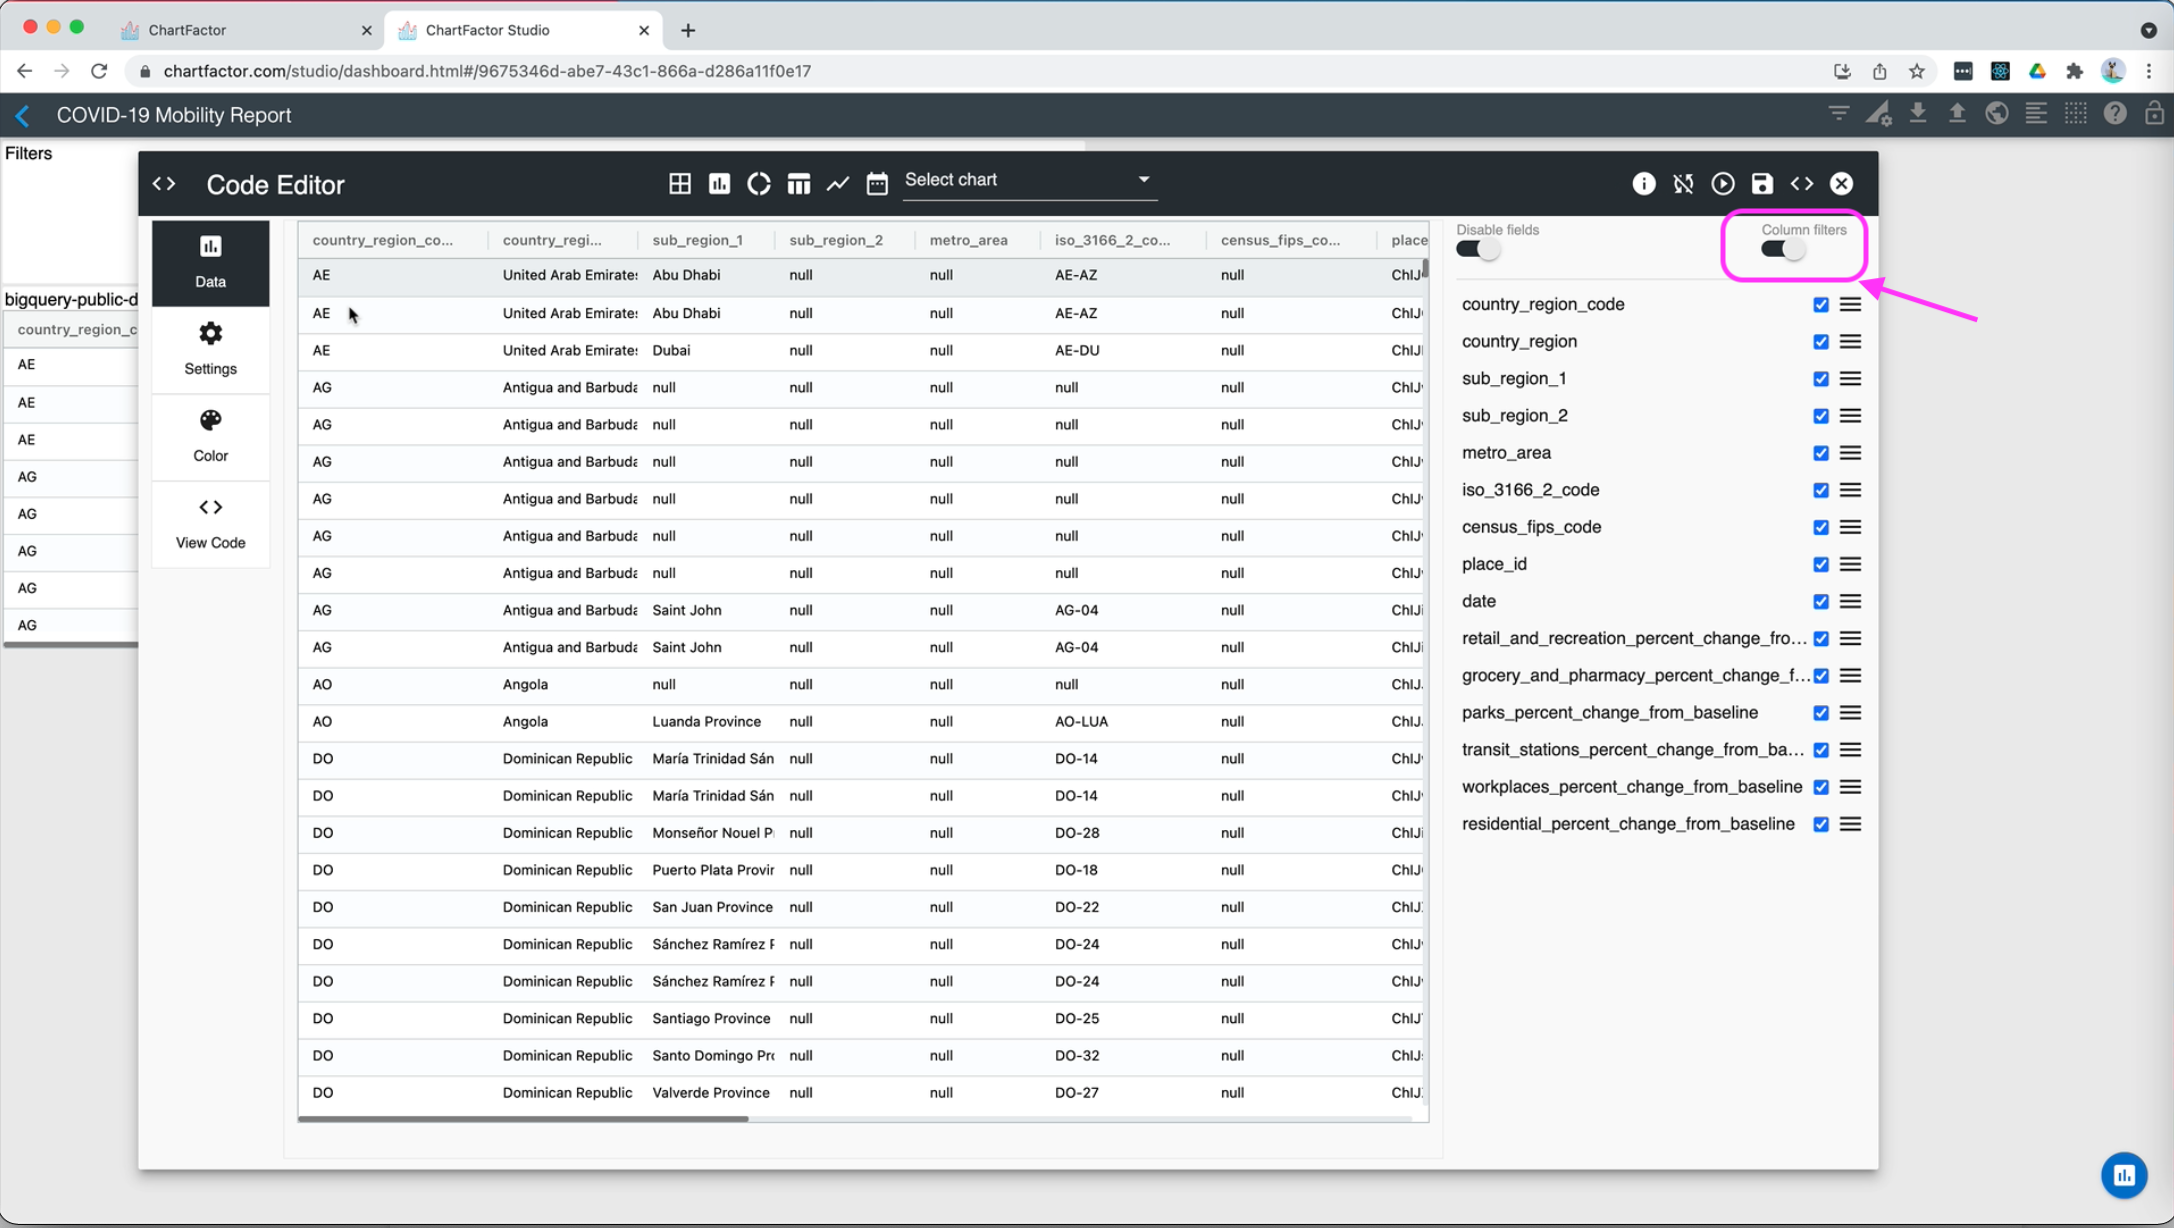
Enable column filters to slice and dice your data straight from the table
-
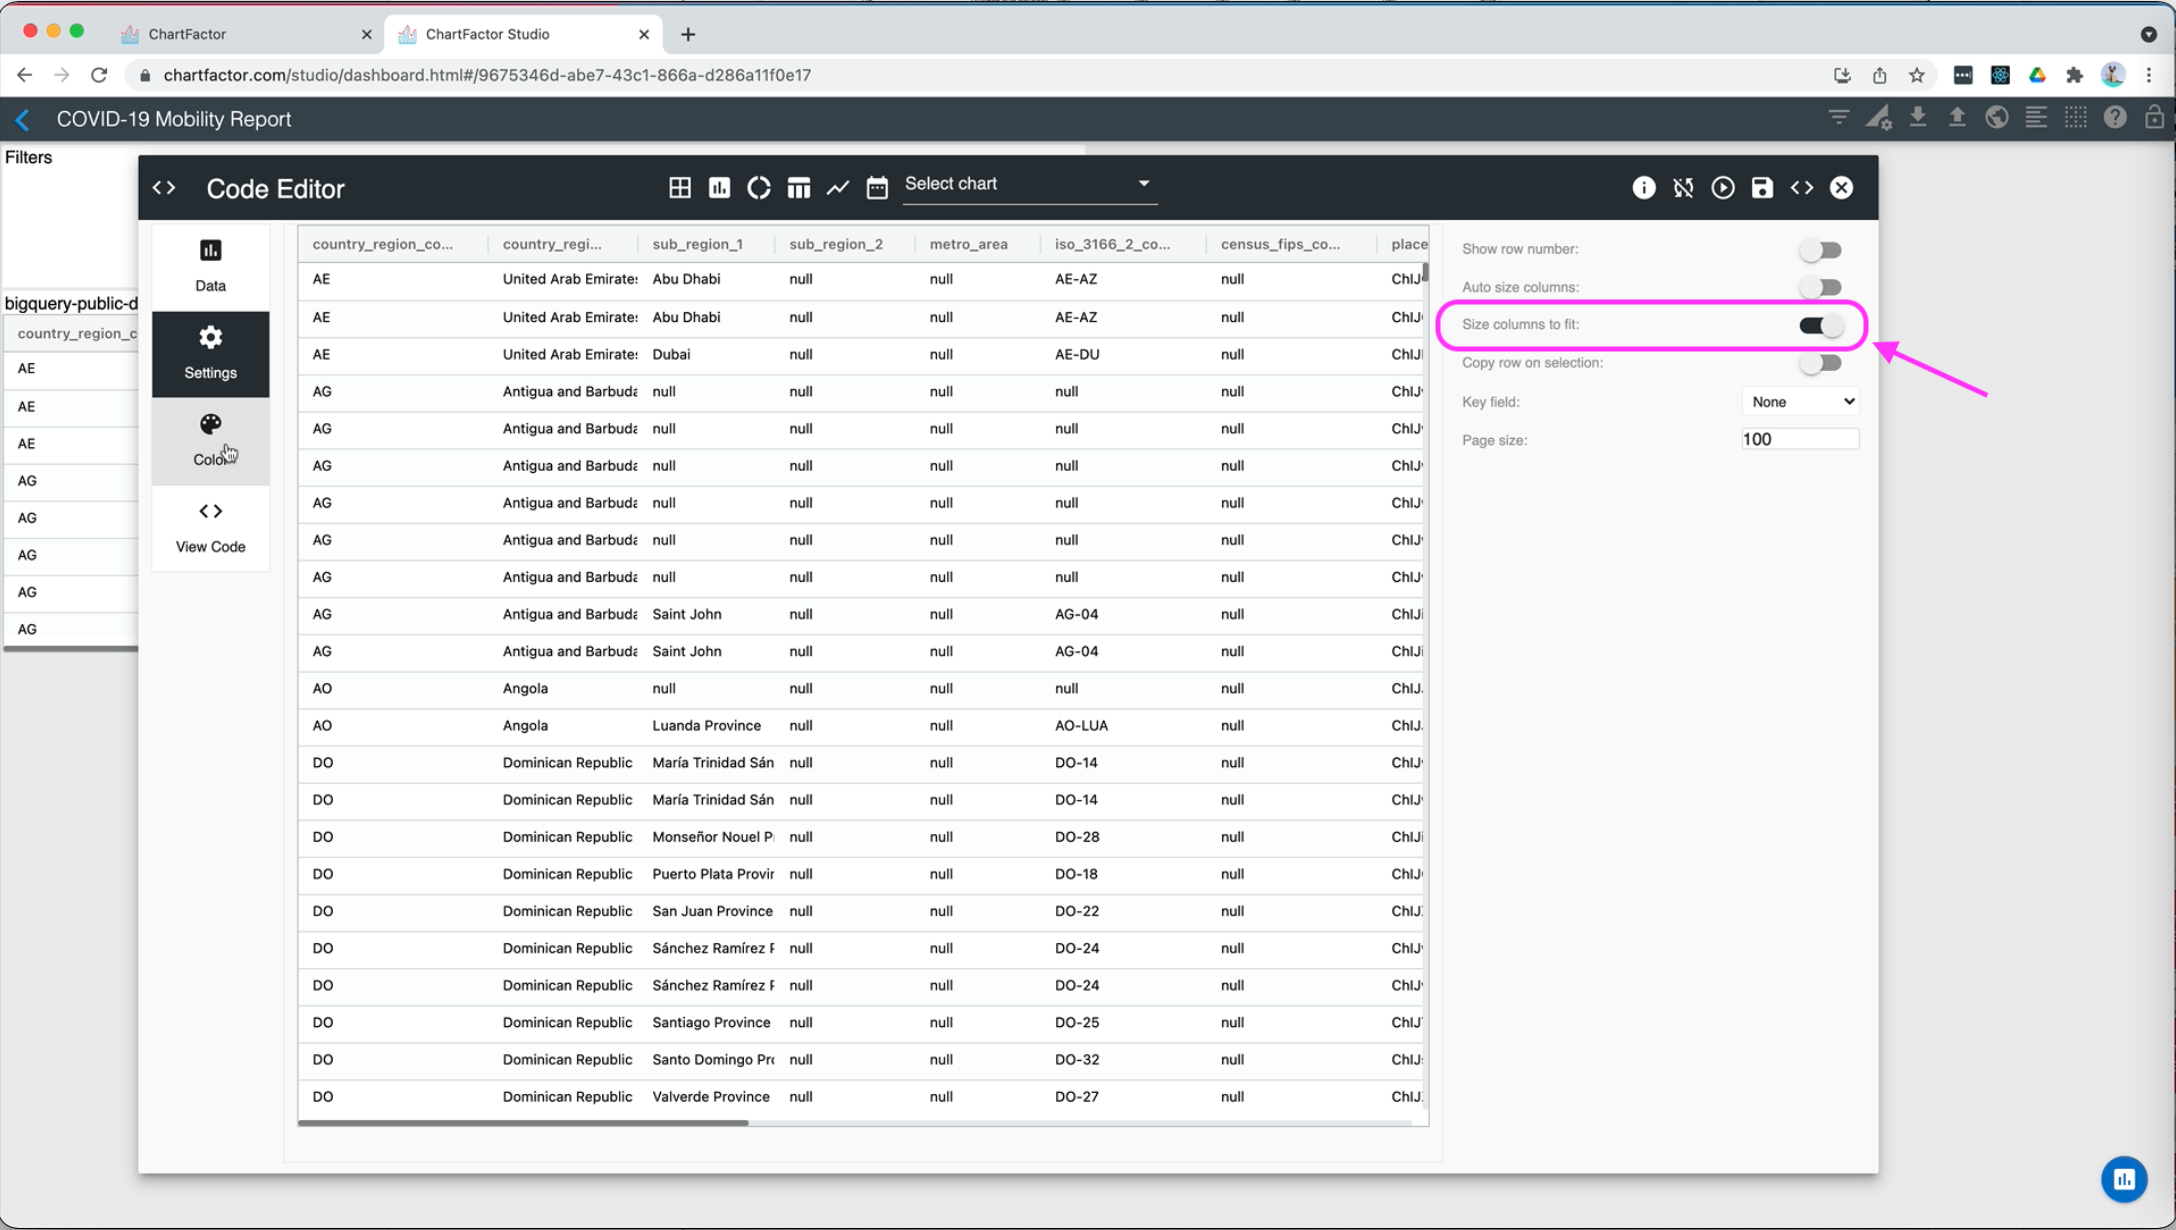
On settings, select "Size columns to fit"
-
Select a color theme and save this visualization
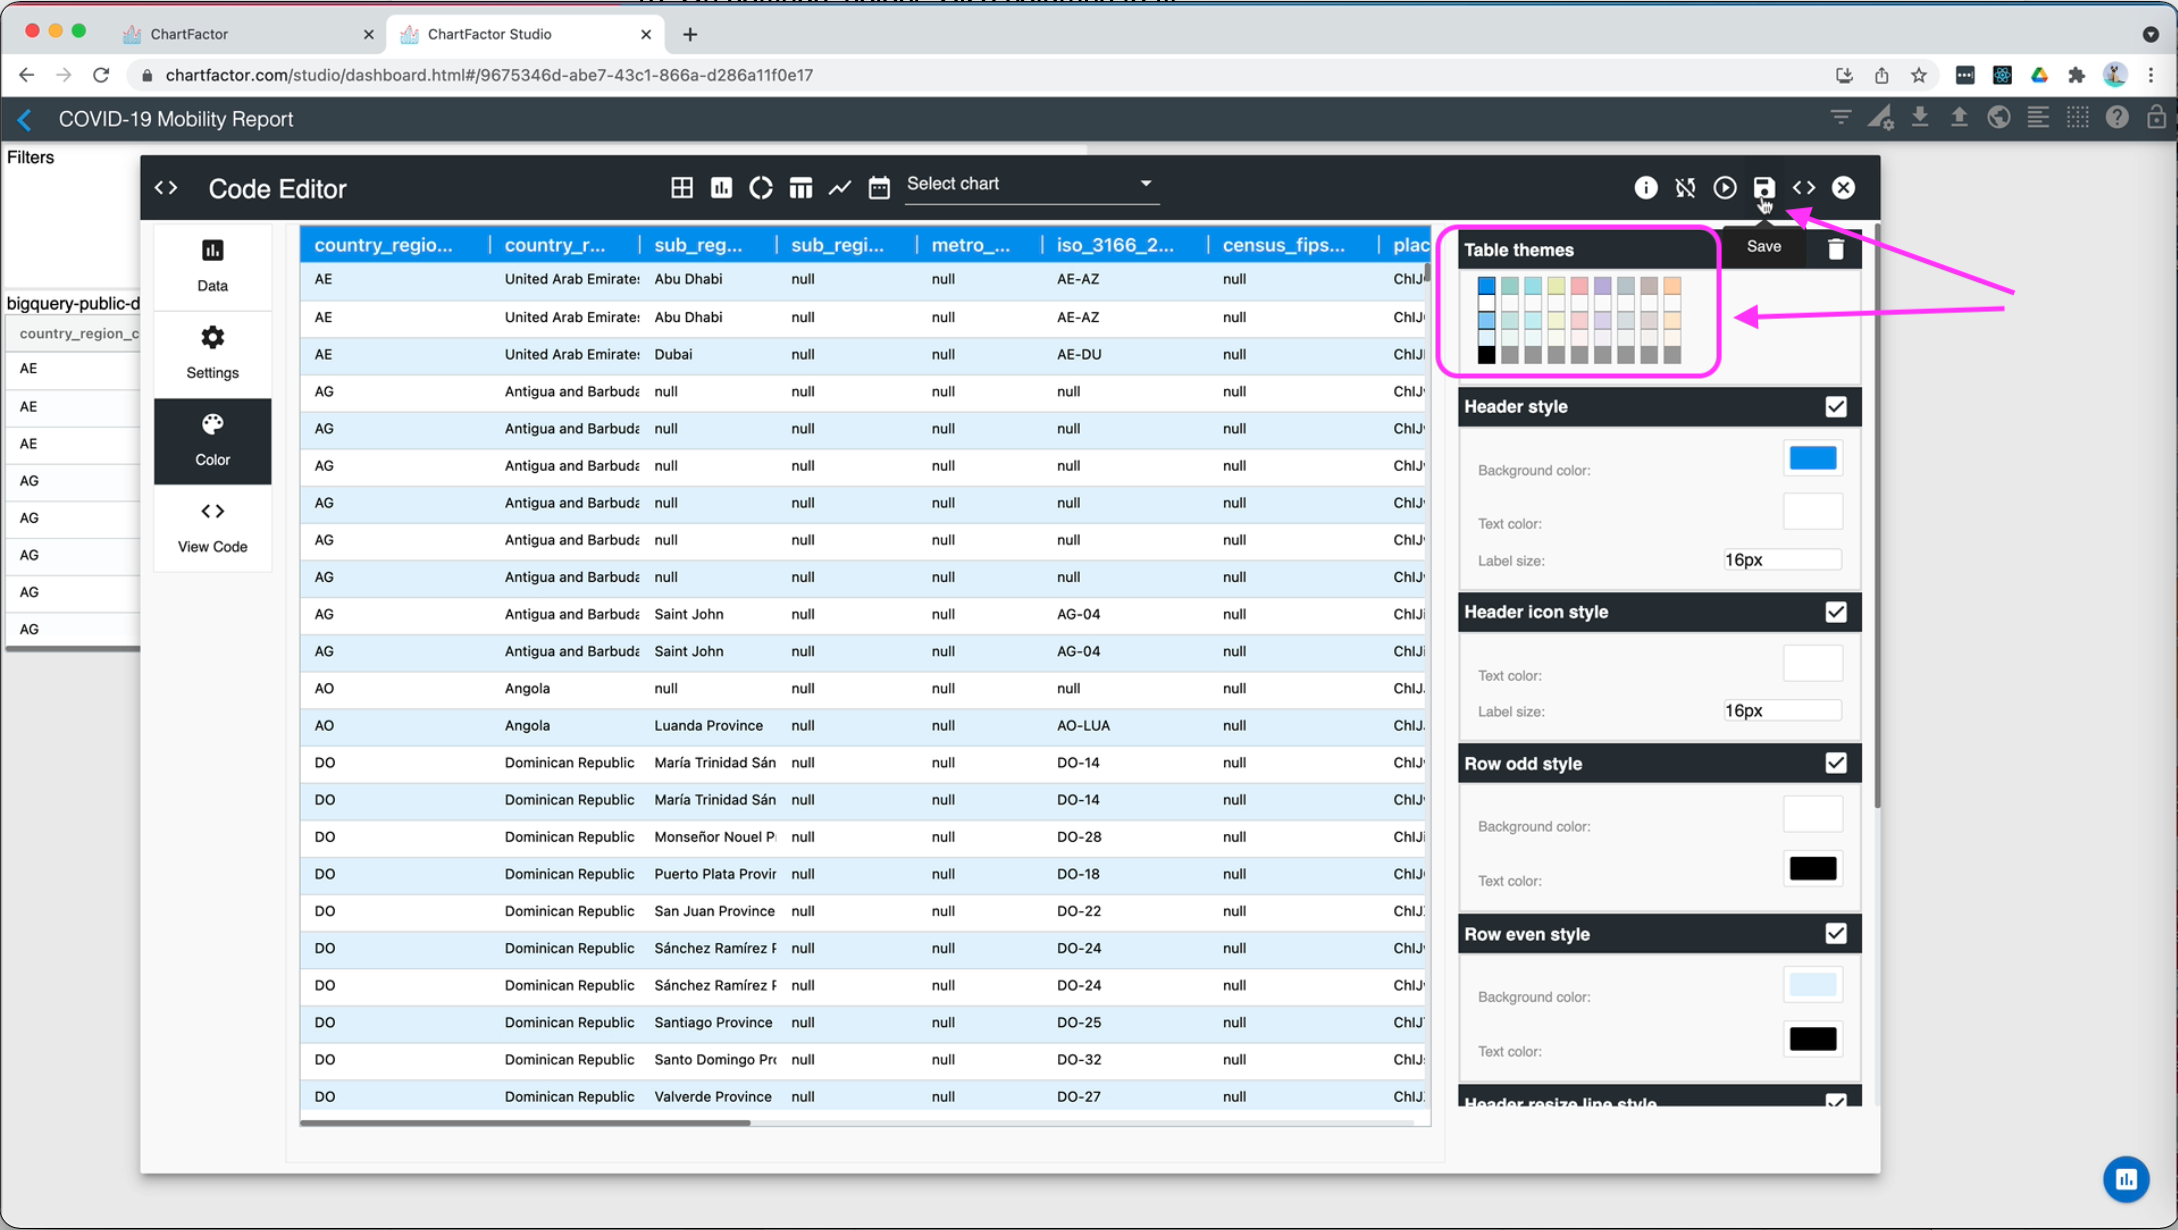
-
Resize your widgets as needed
-
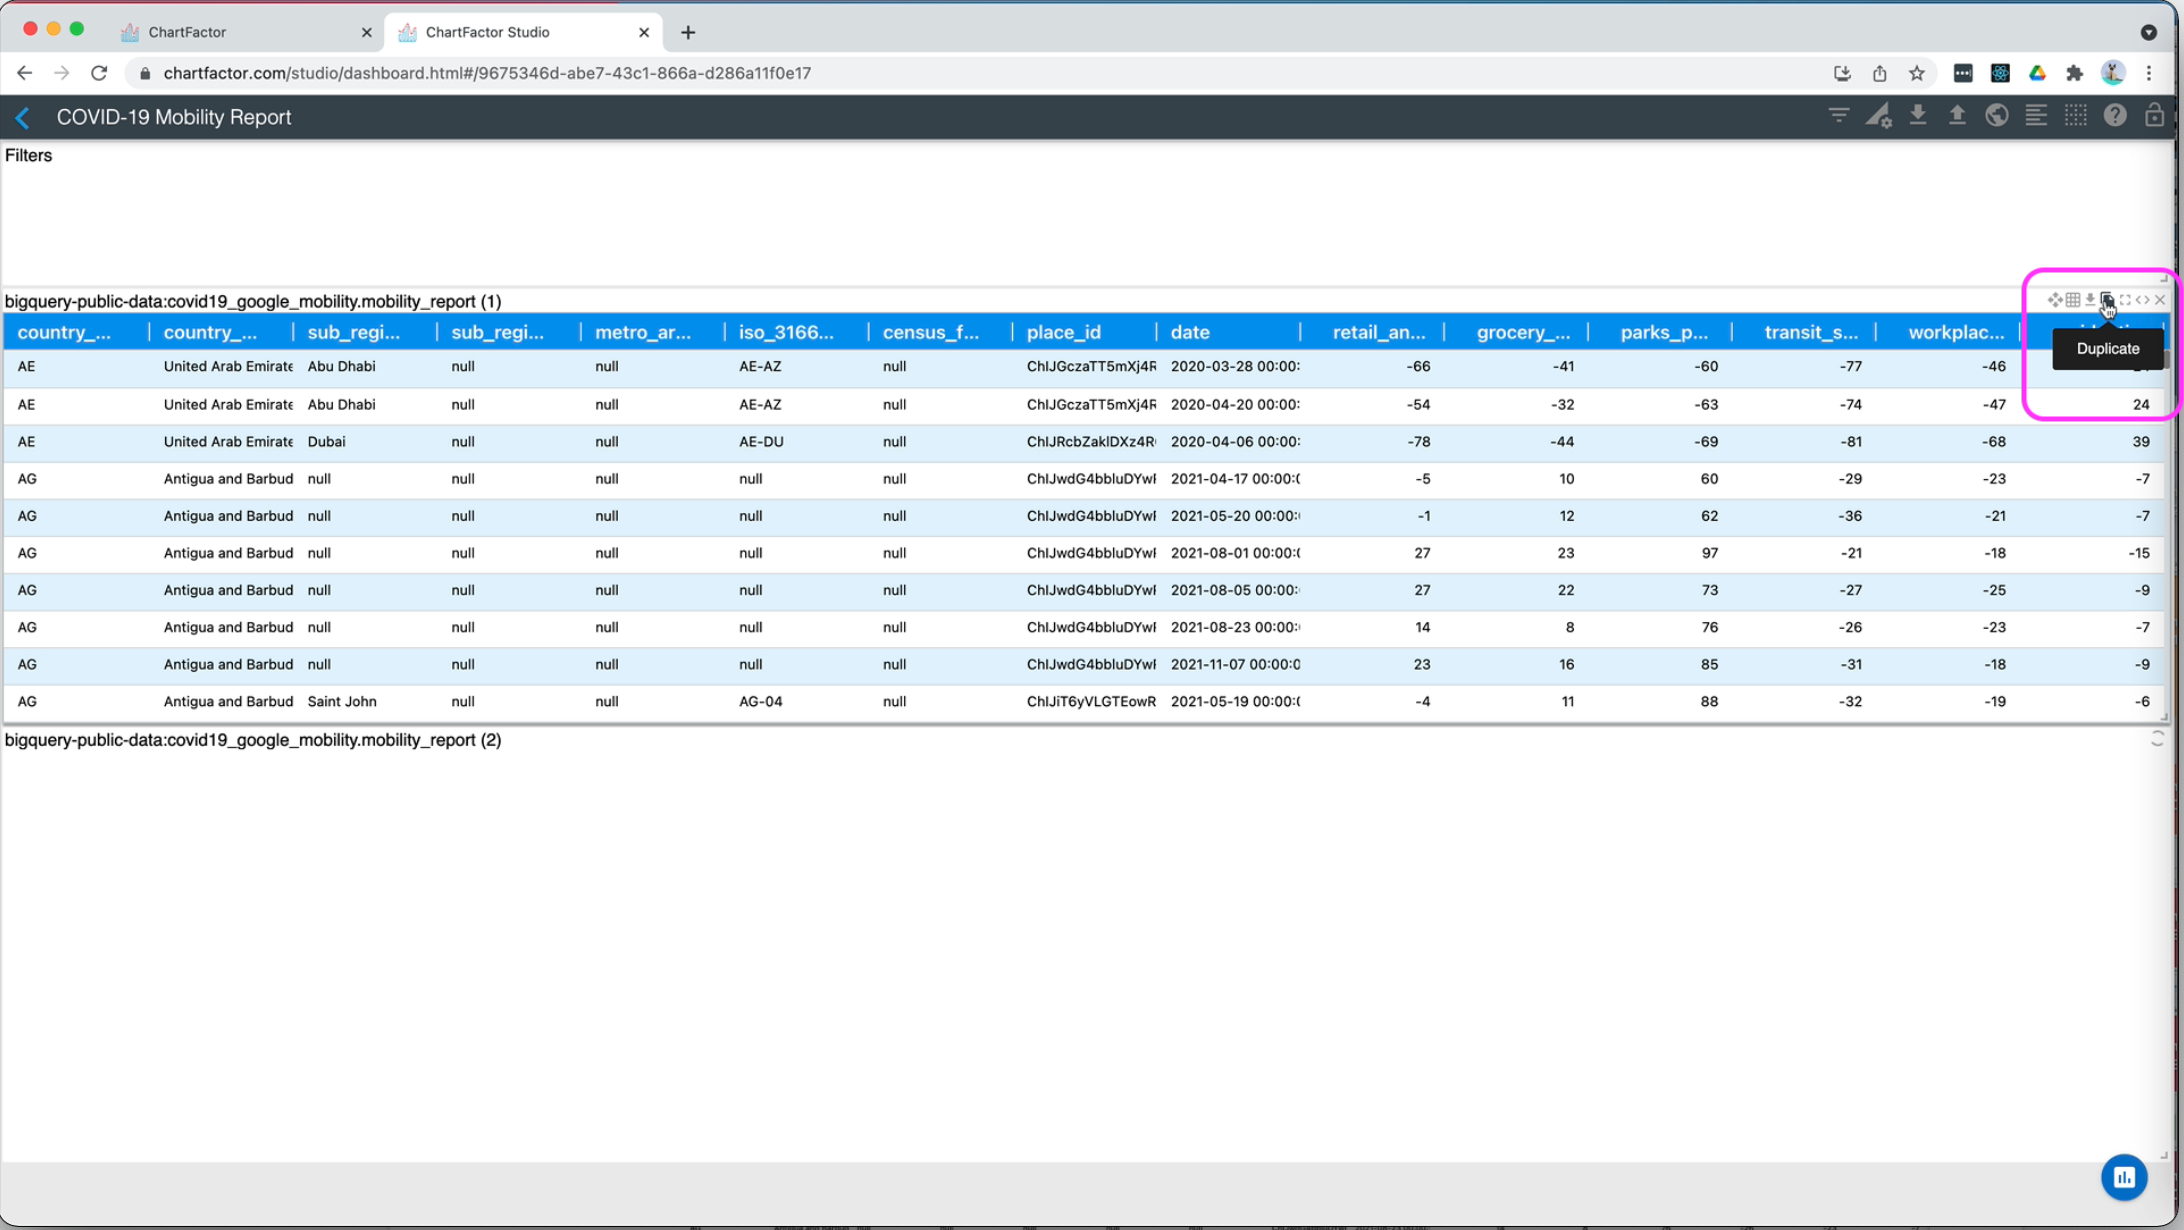
Now let's trend the data by creating a Multi-metric Trend chart. The easiest way is to duplicate your table chart by selecting its “duplicate” button.
-
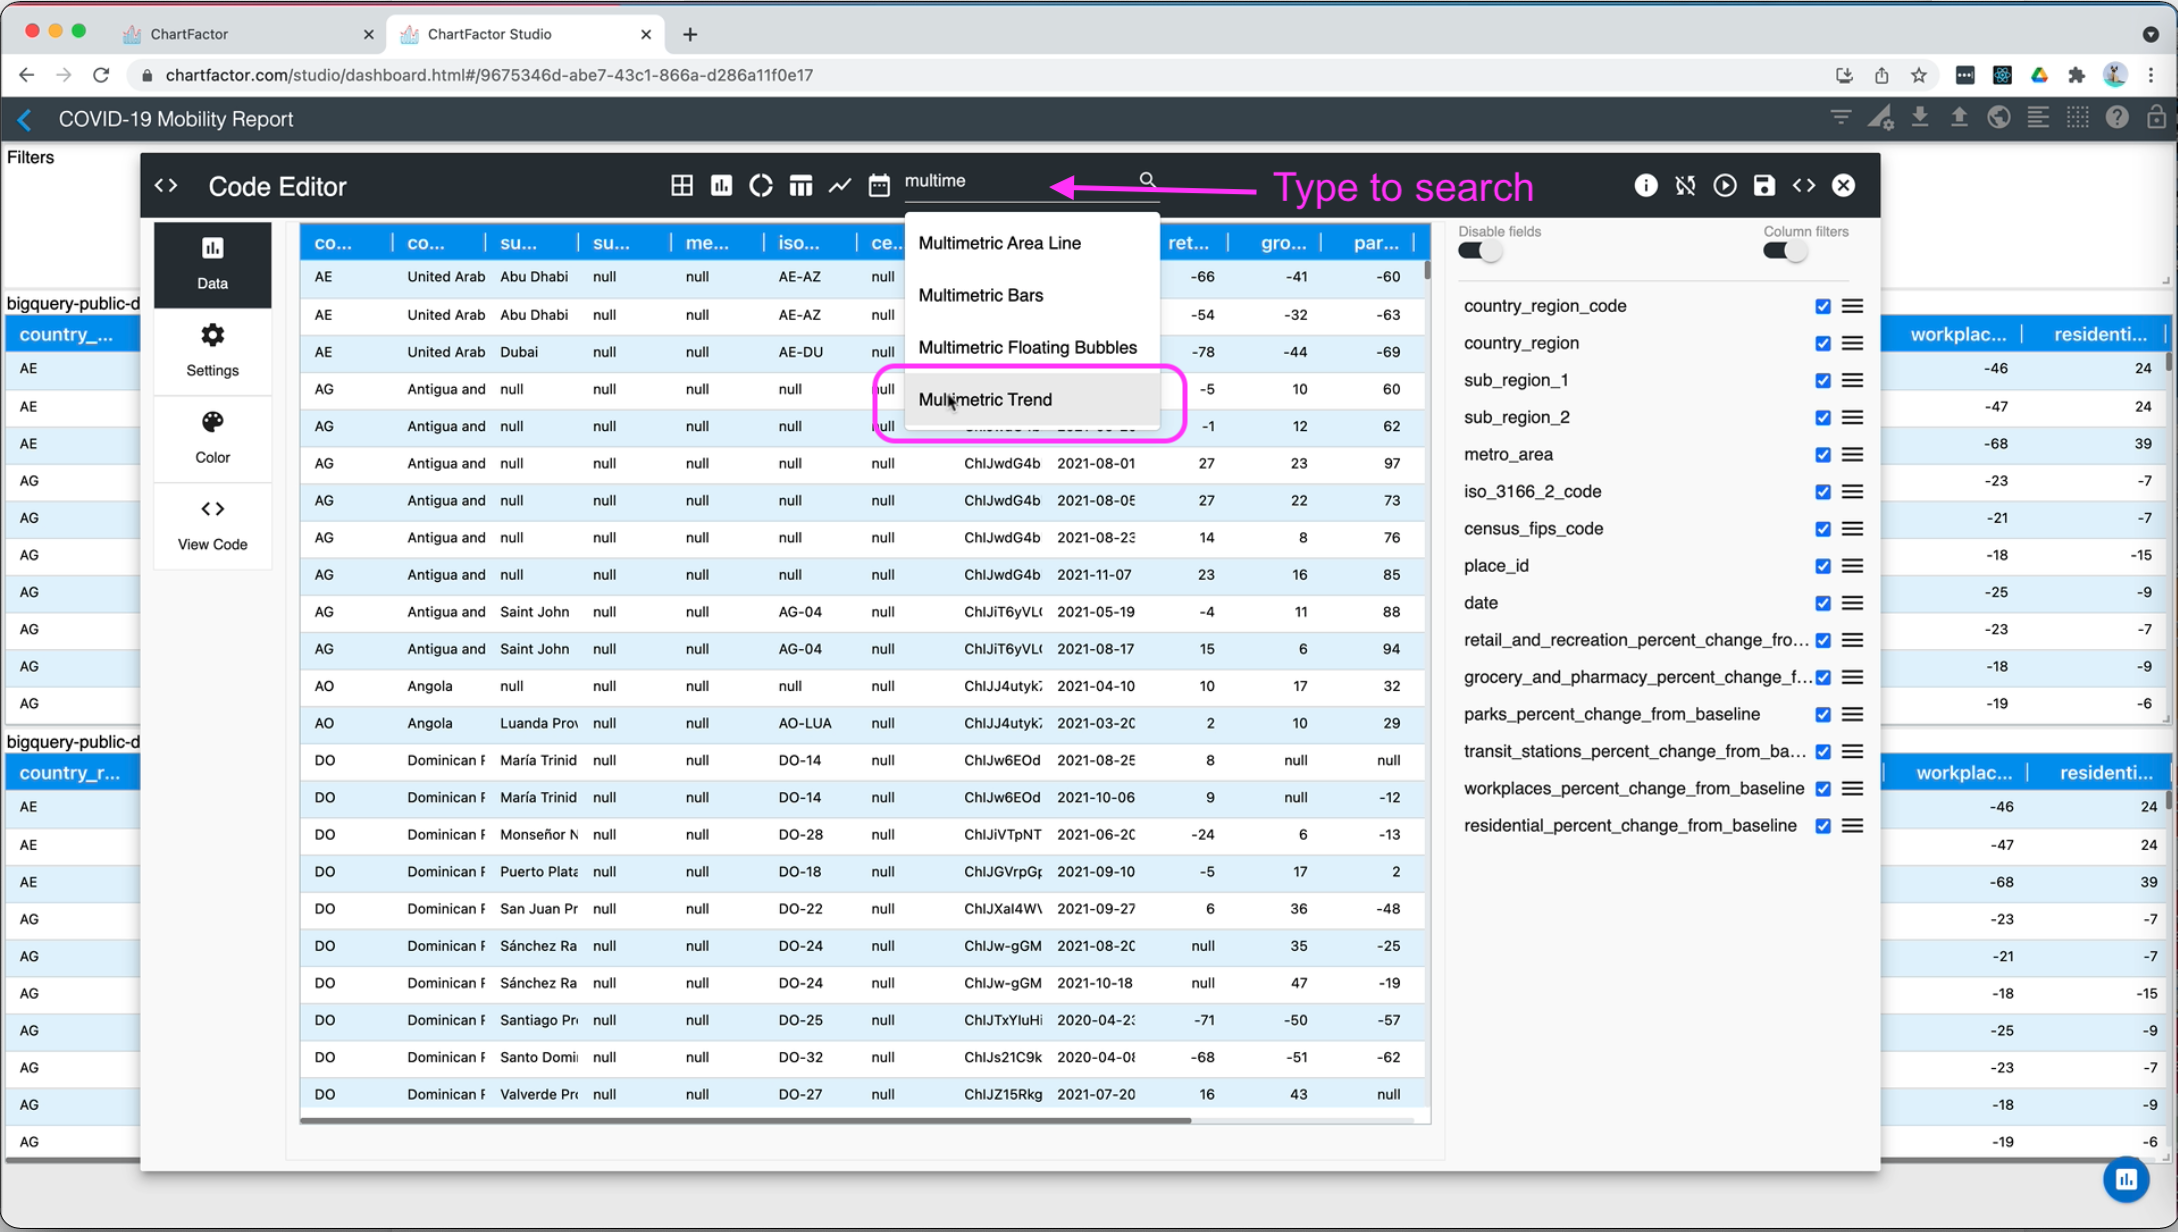
Open the editor of the duplicated visualization and select the multi-metric trend chart
-
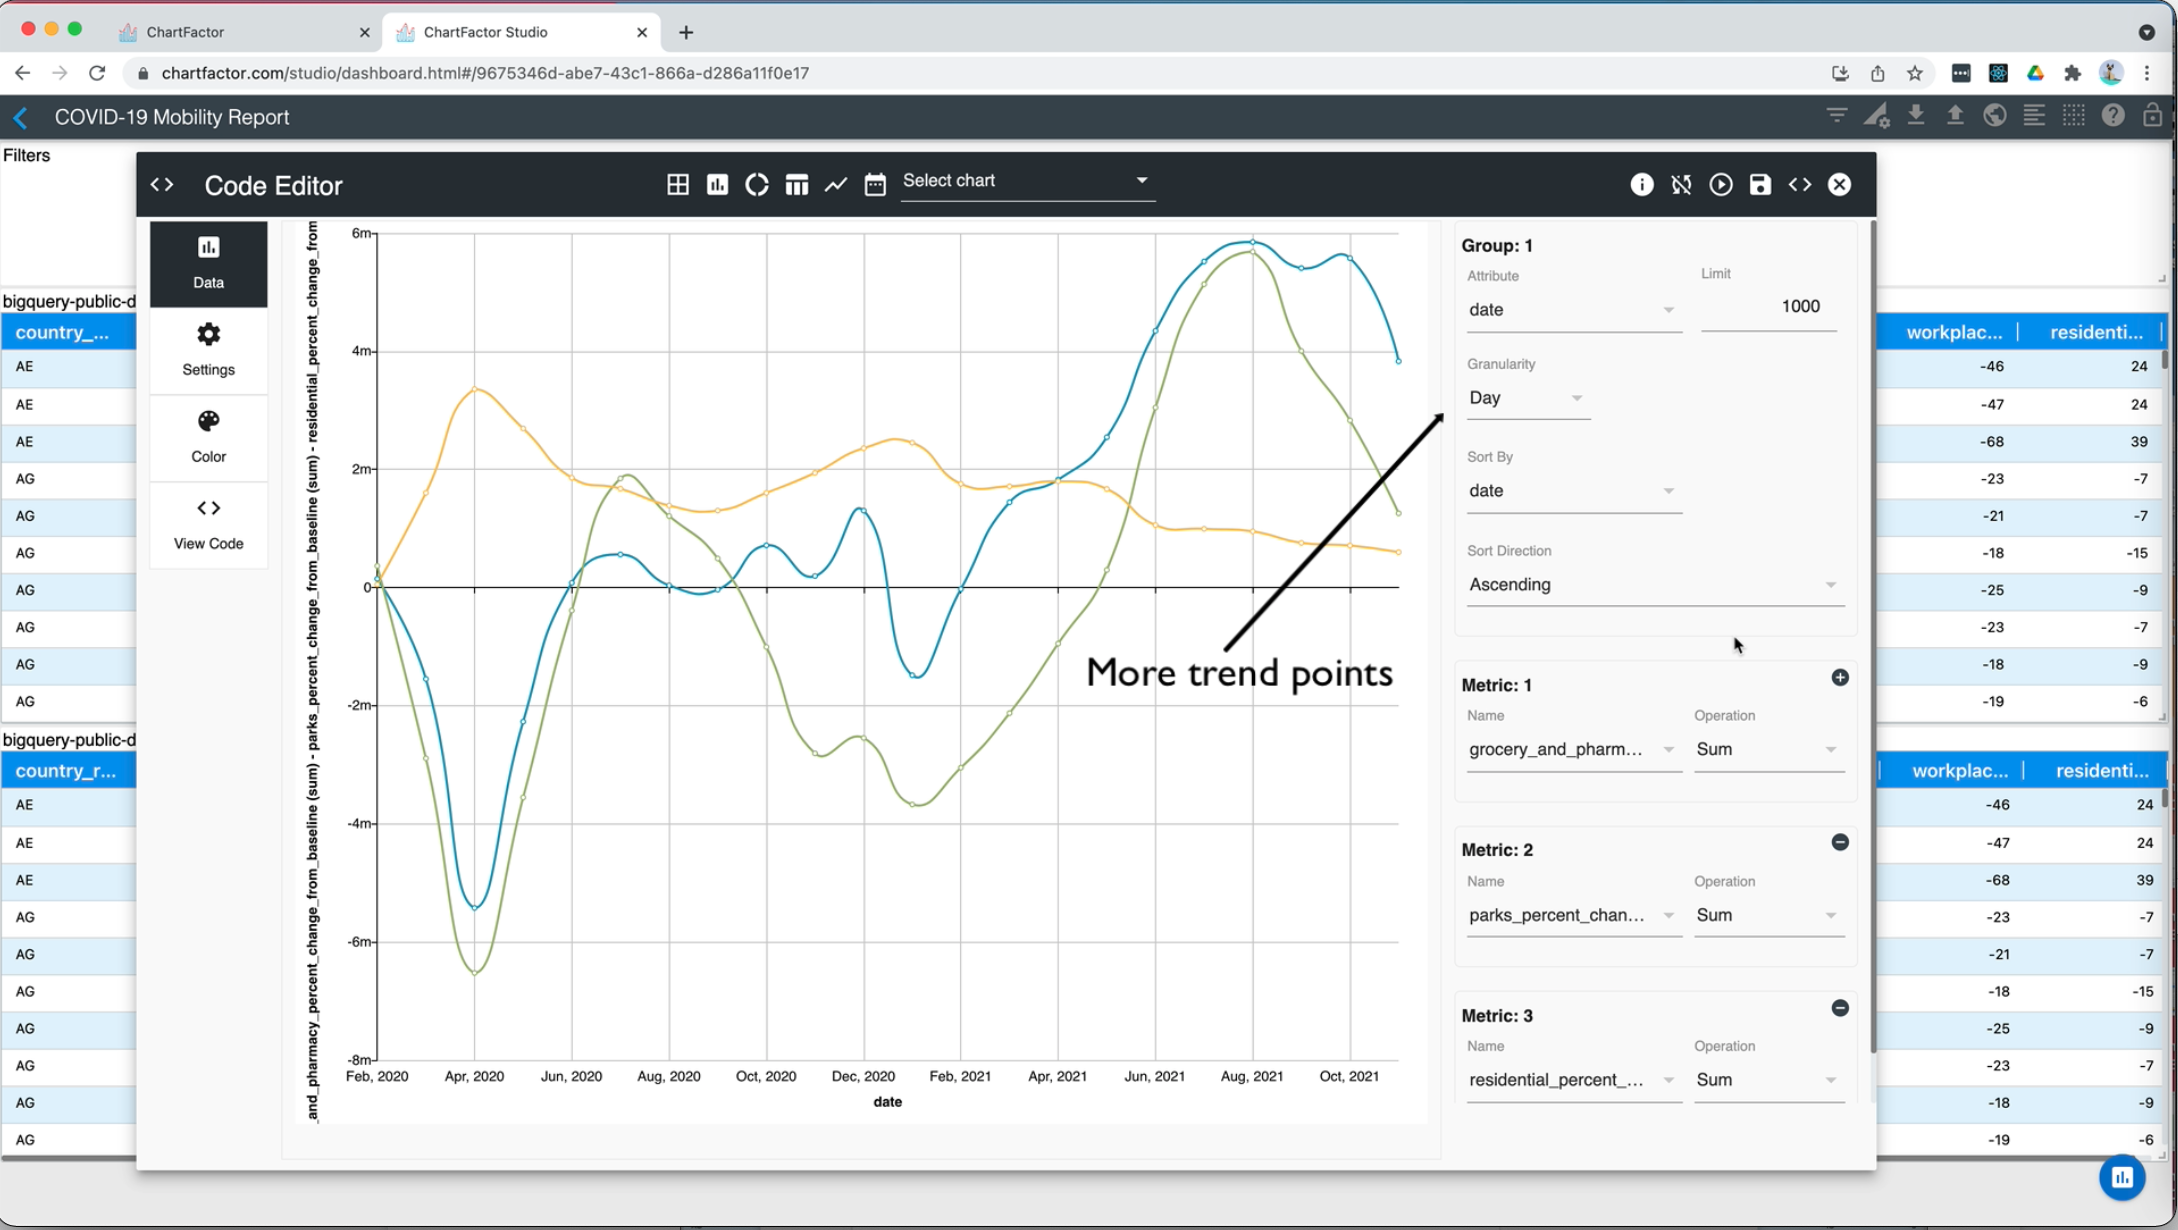
Now that you have selected your Trend chart, change the time granularity to DAY instead of MONTH to have more points in your trend
-
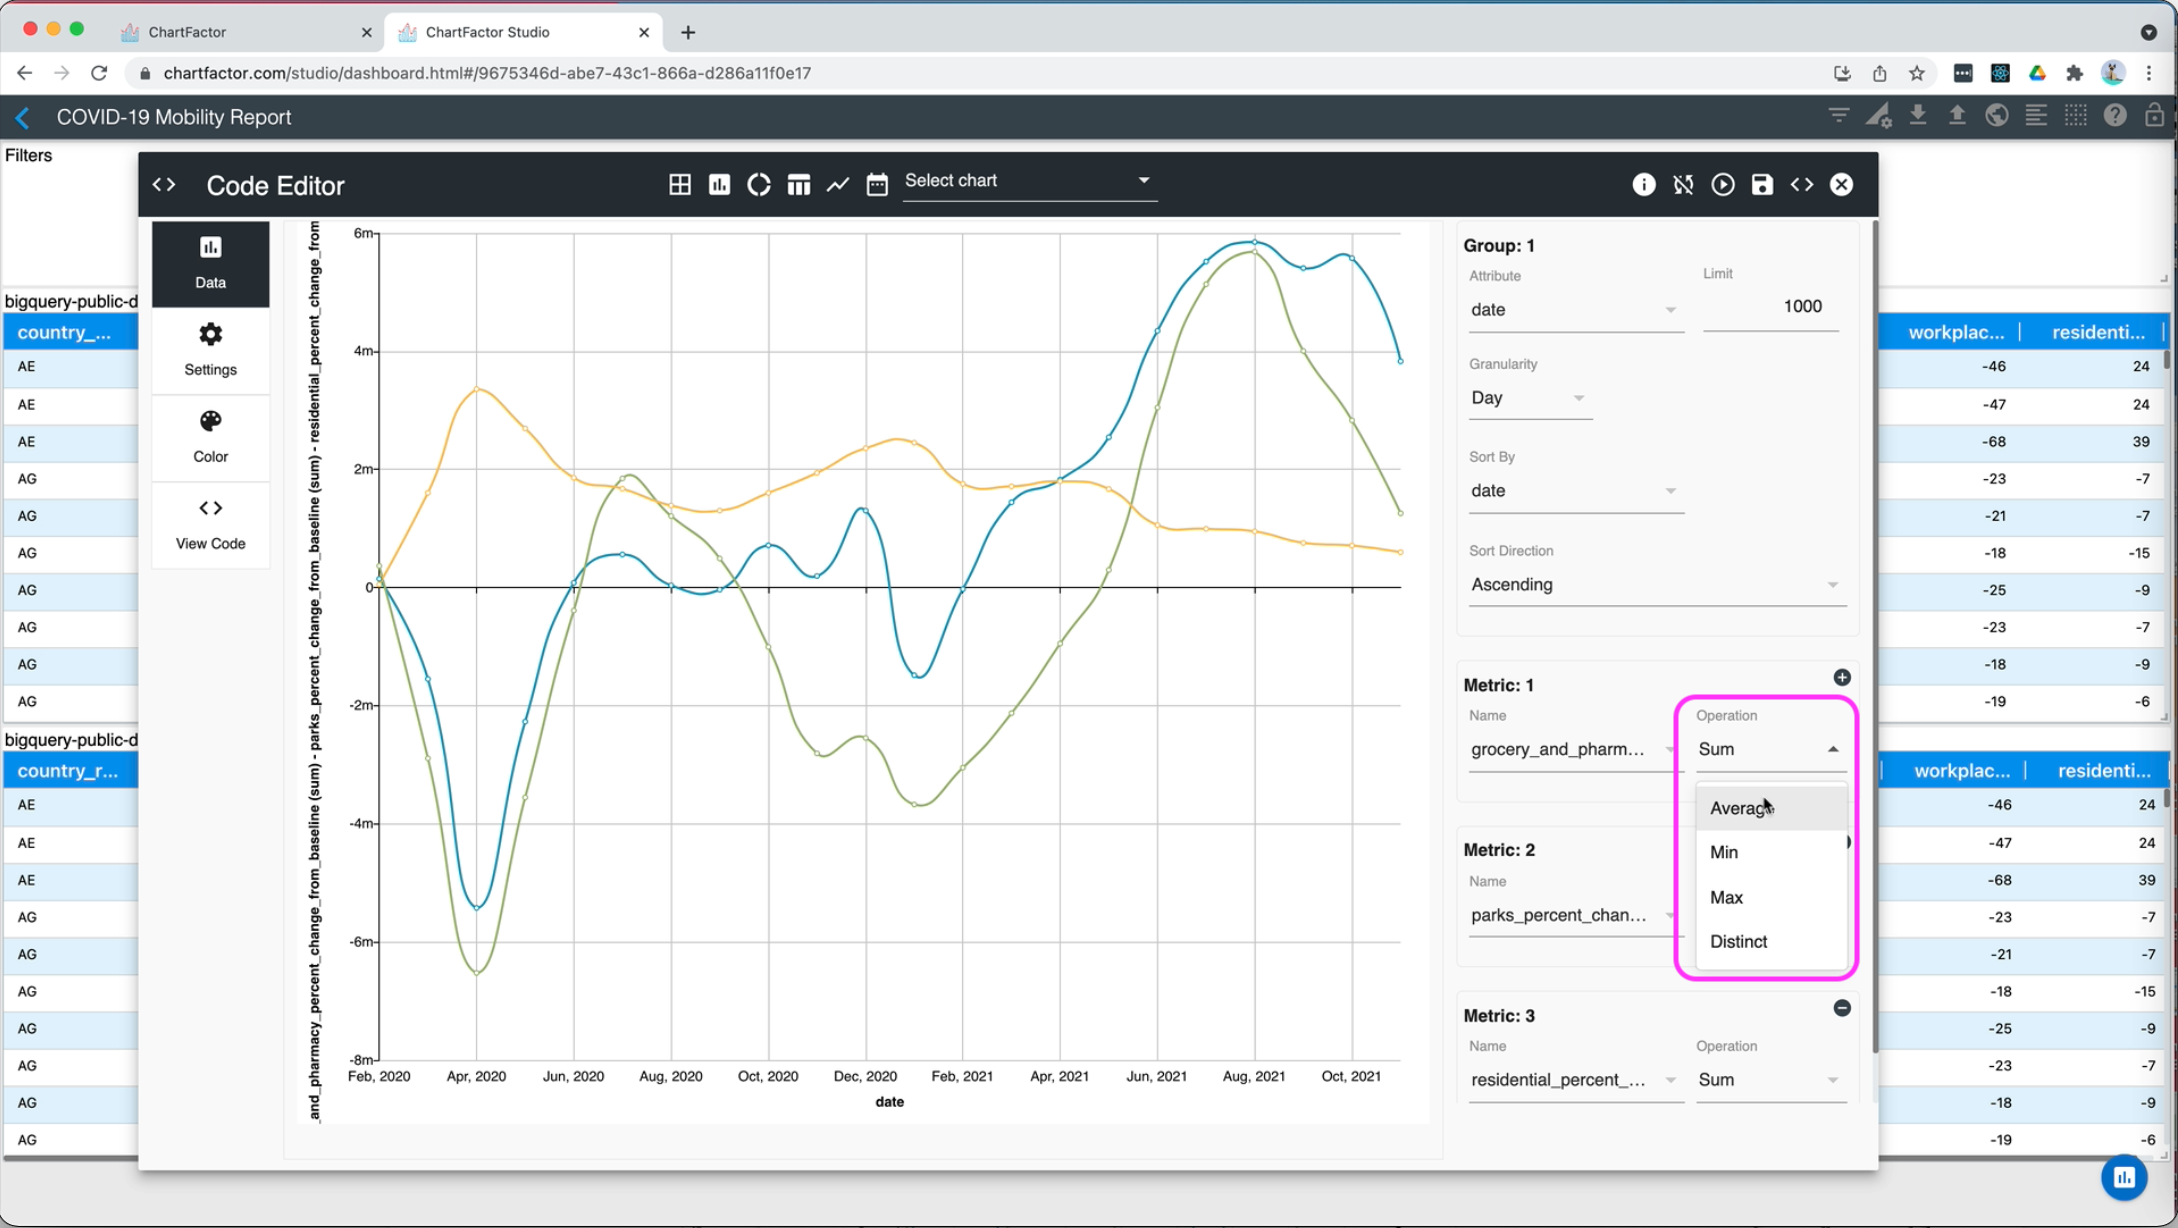
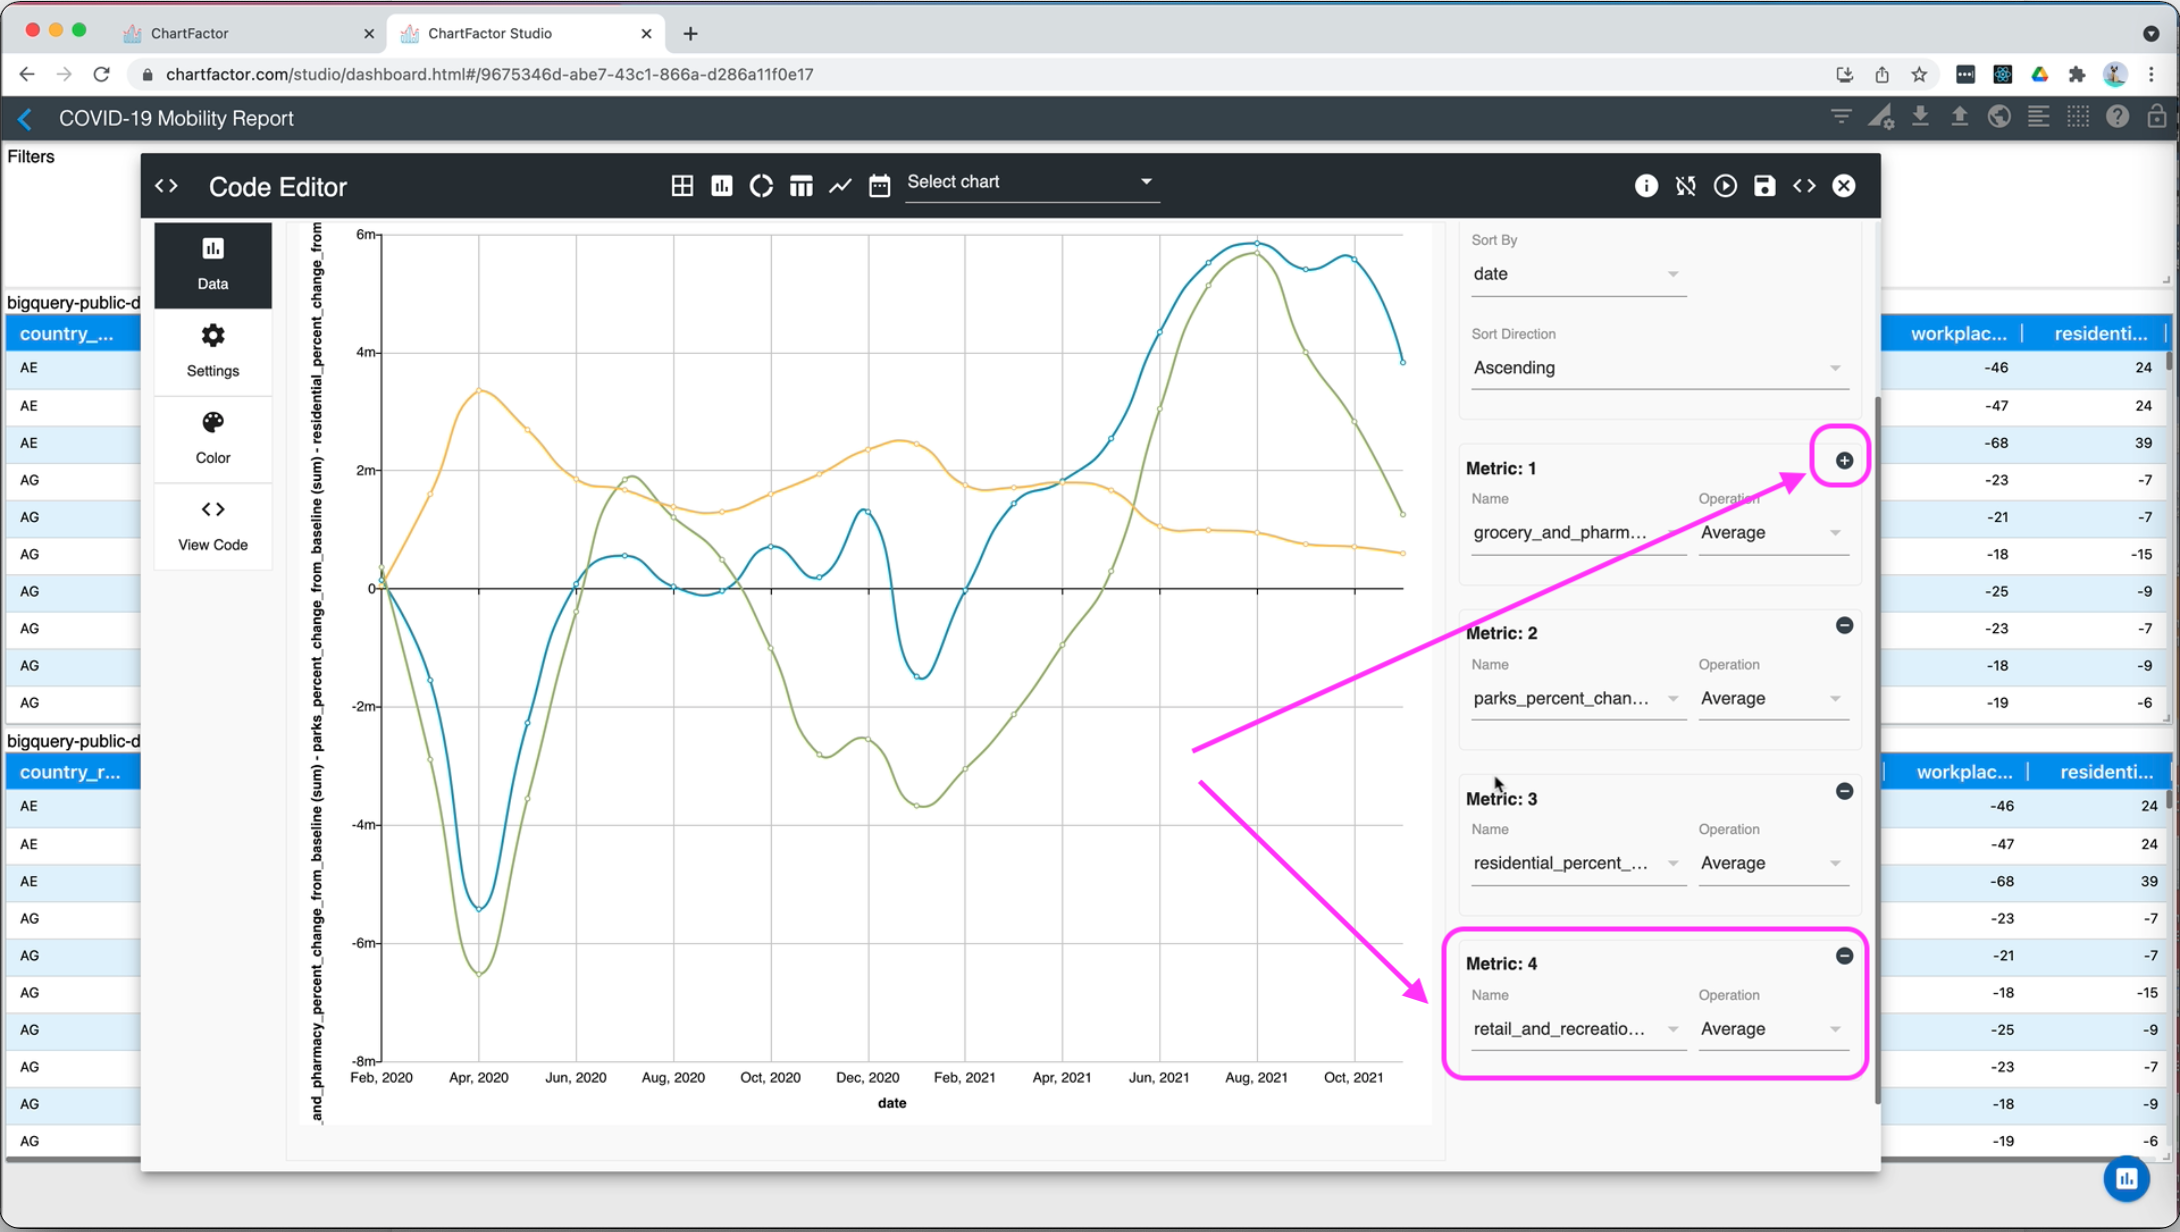
Change the metric operations to AVERAGE instead of SUM. Do that for all metrics.
-
Add a new metric by clicking on the metric plus (+) button and select the retail metric
-
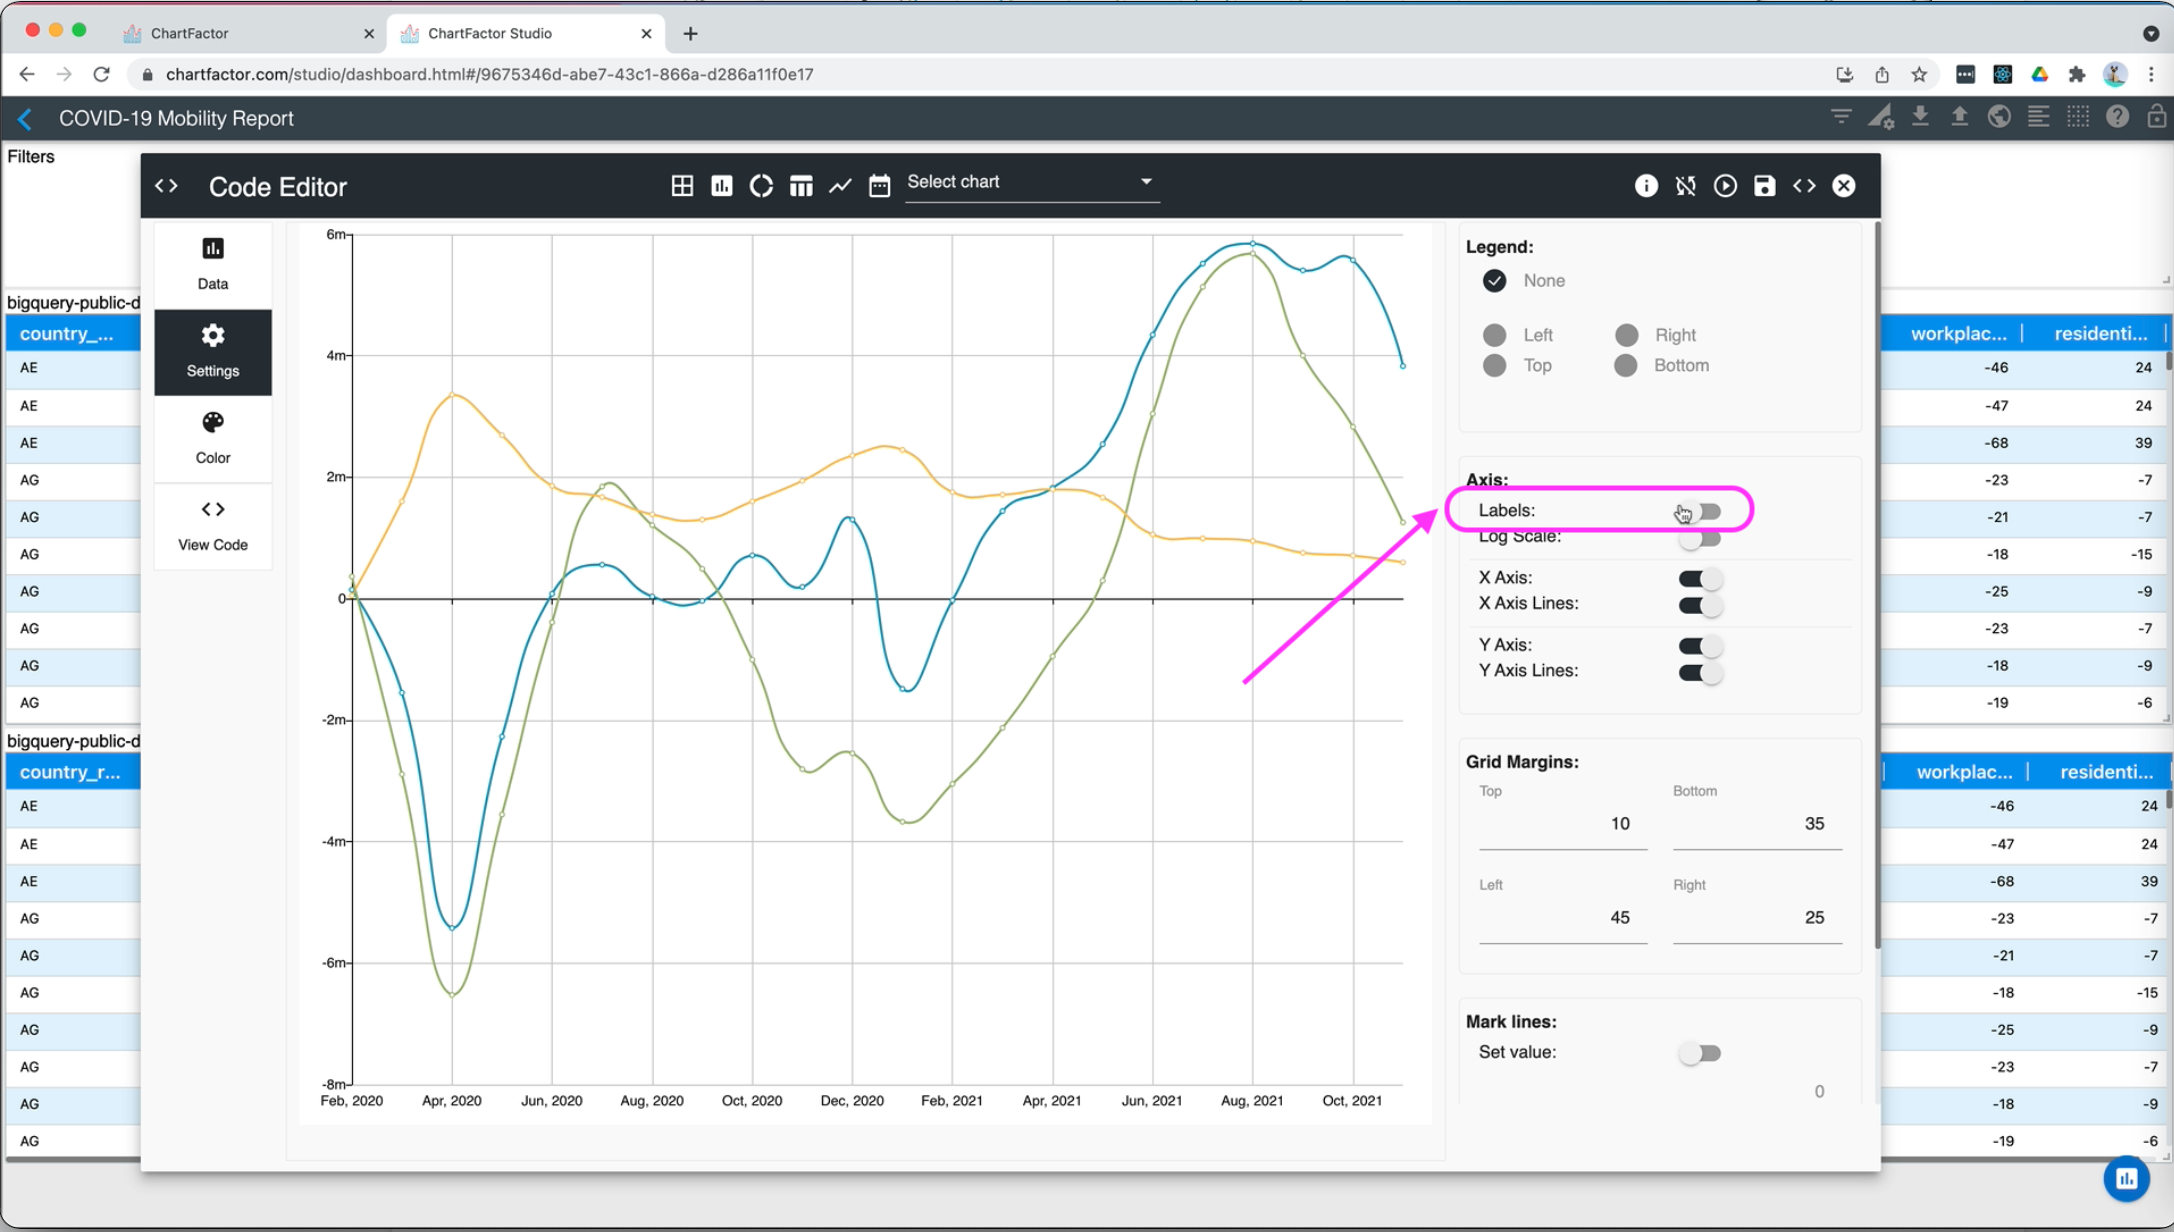
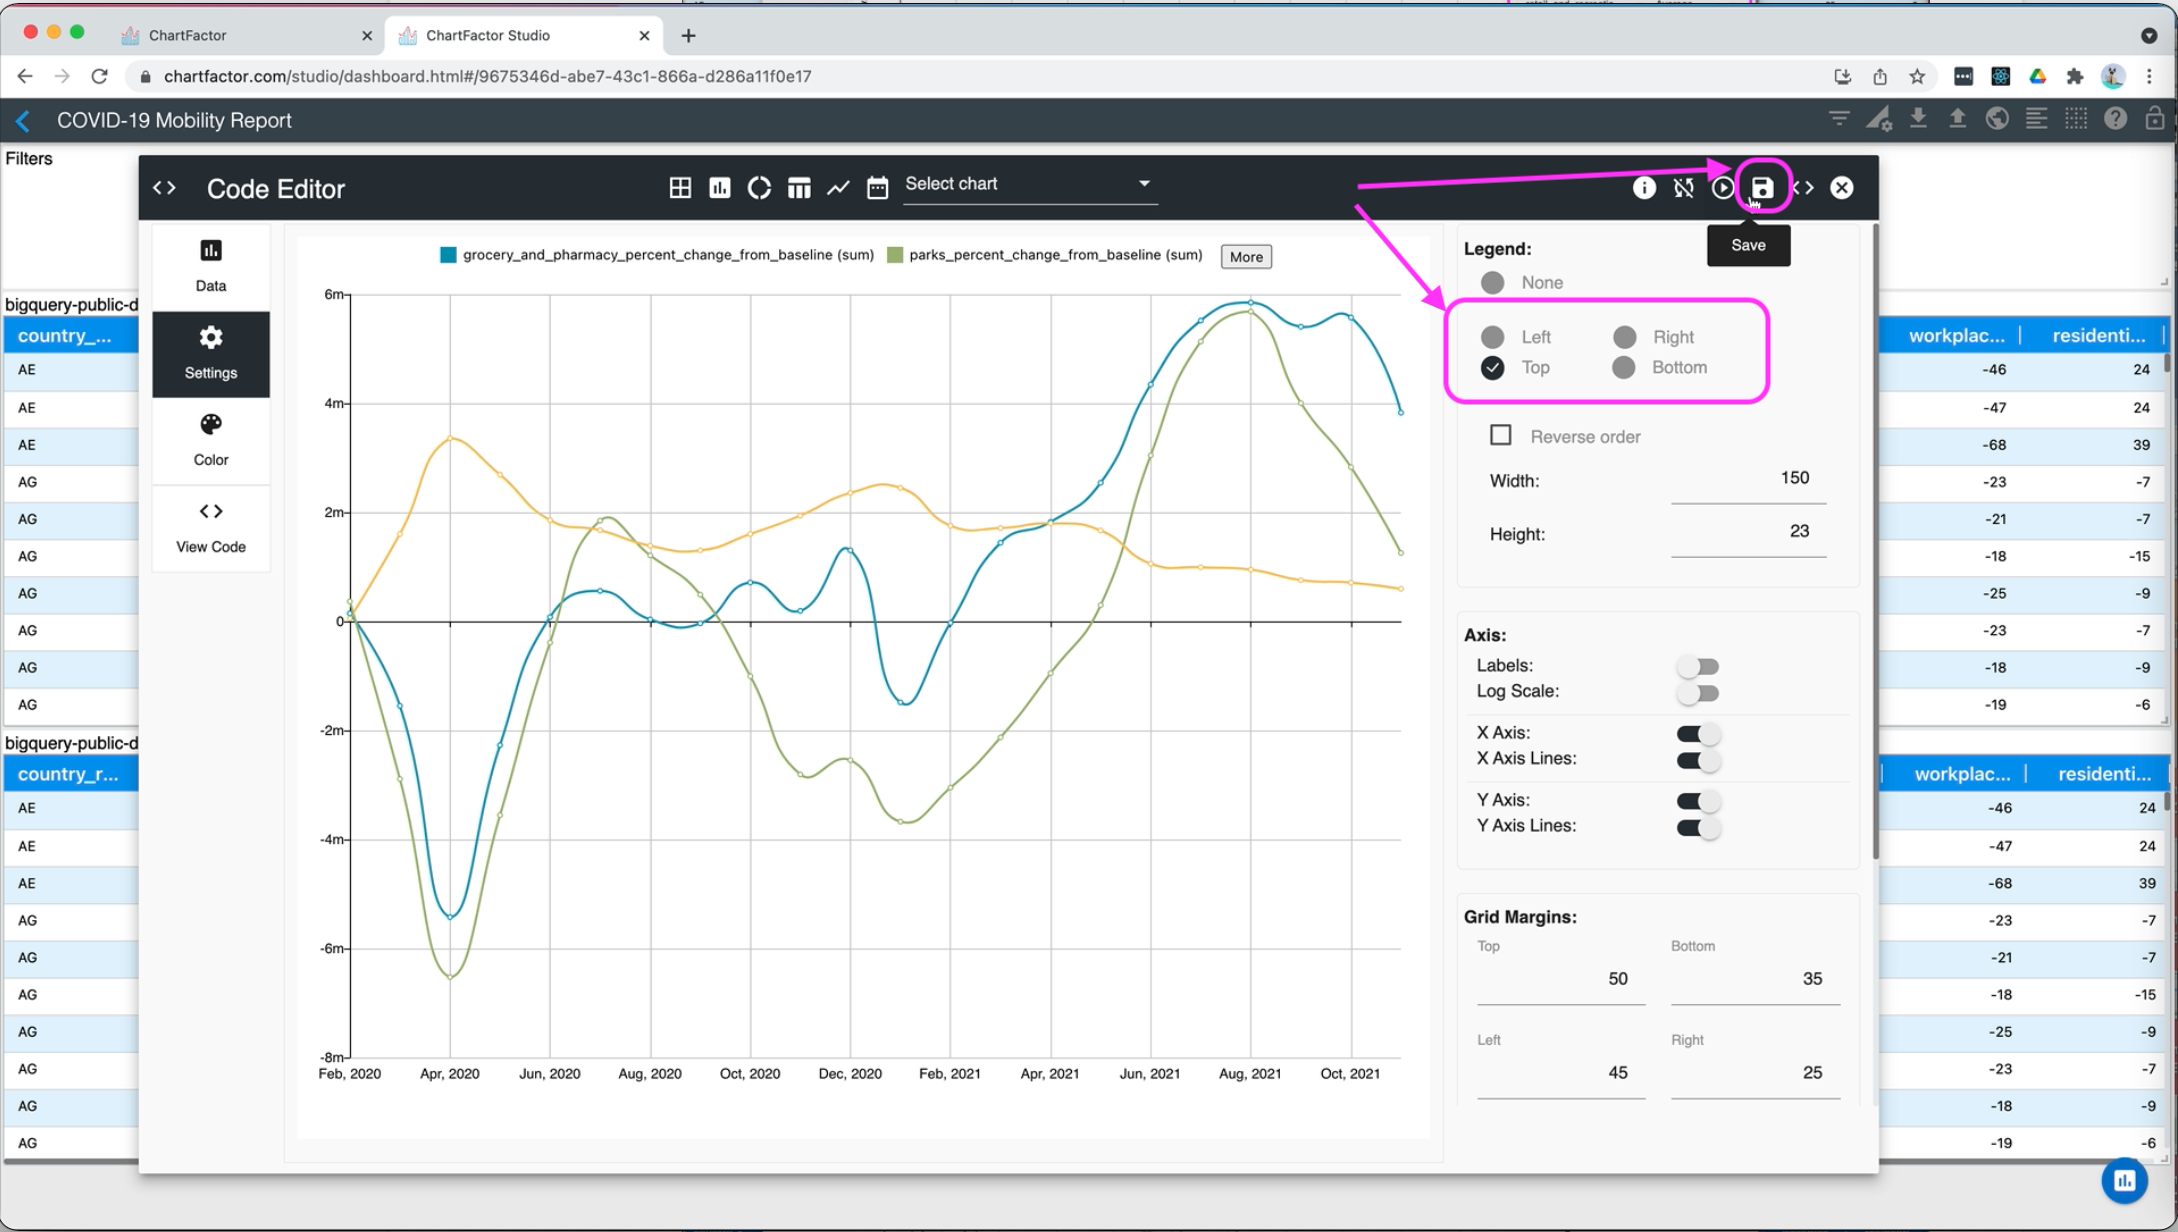
Go to settings and remove labels
-
Enable the legend at the top and save your trend chart
-
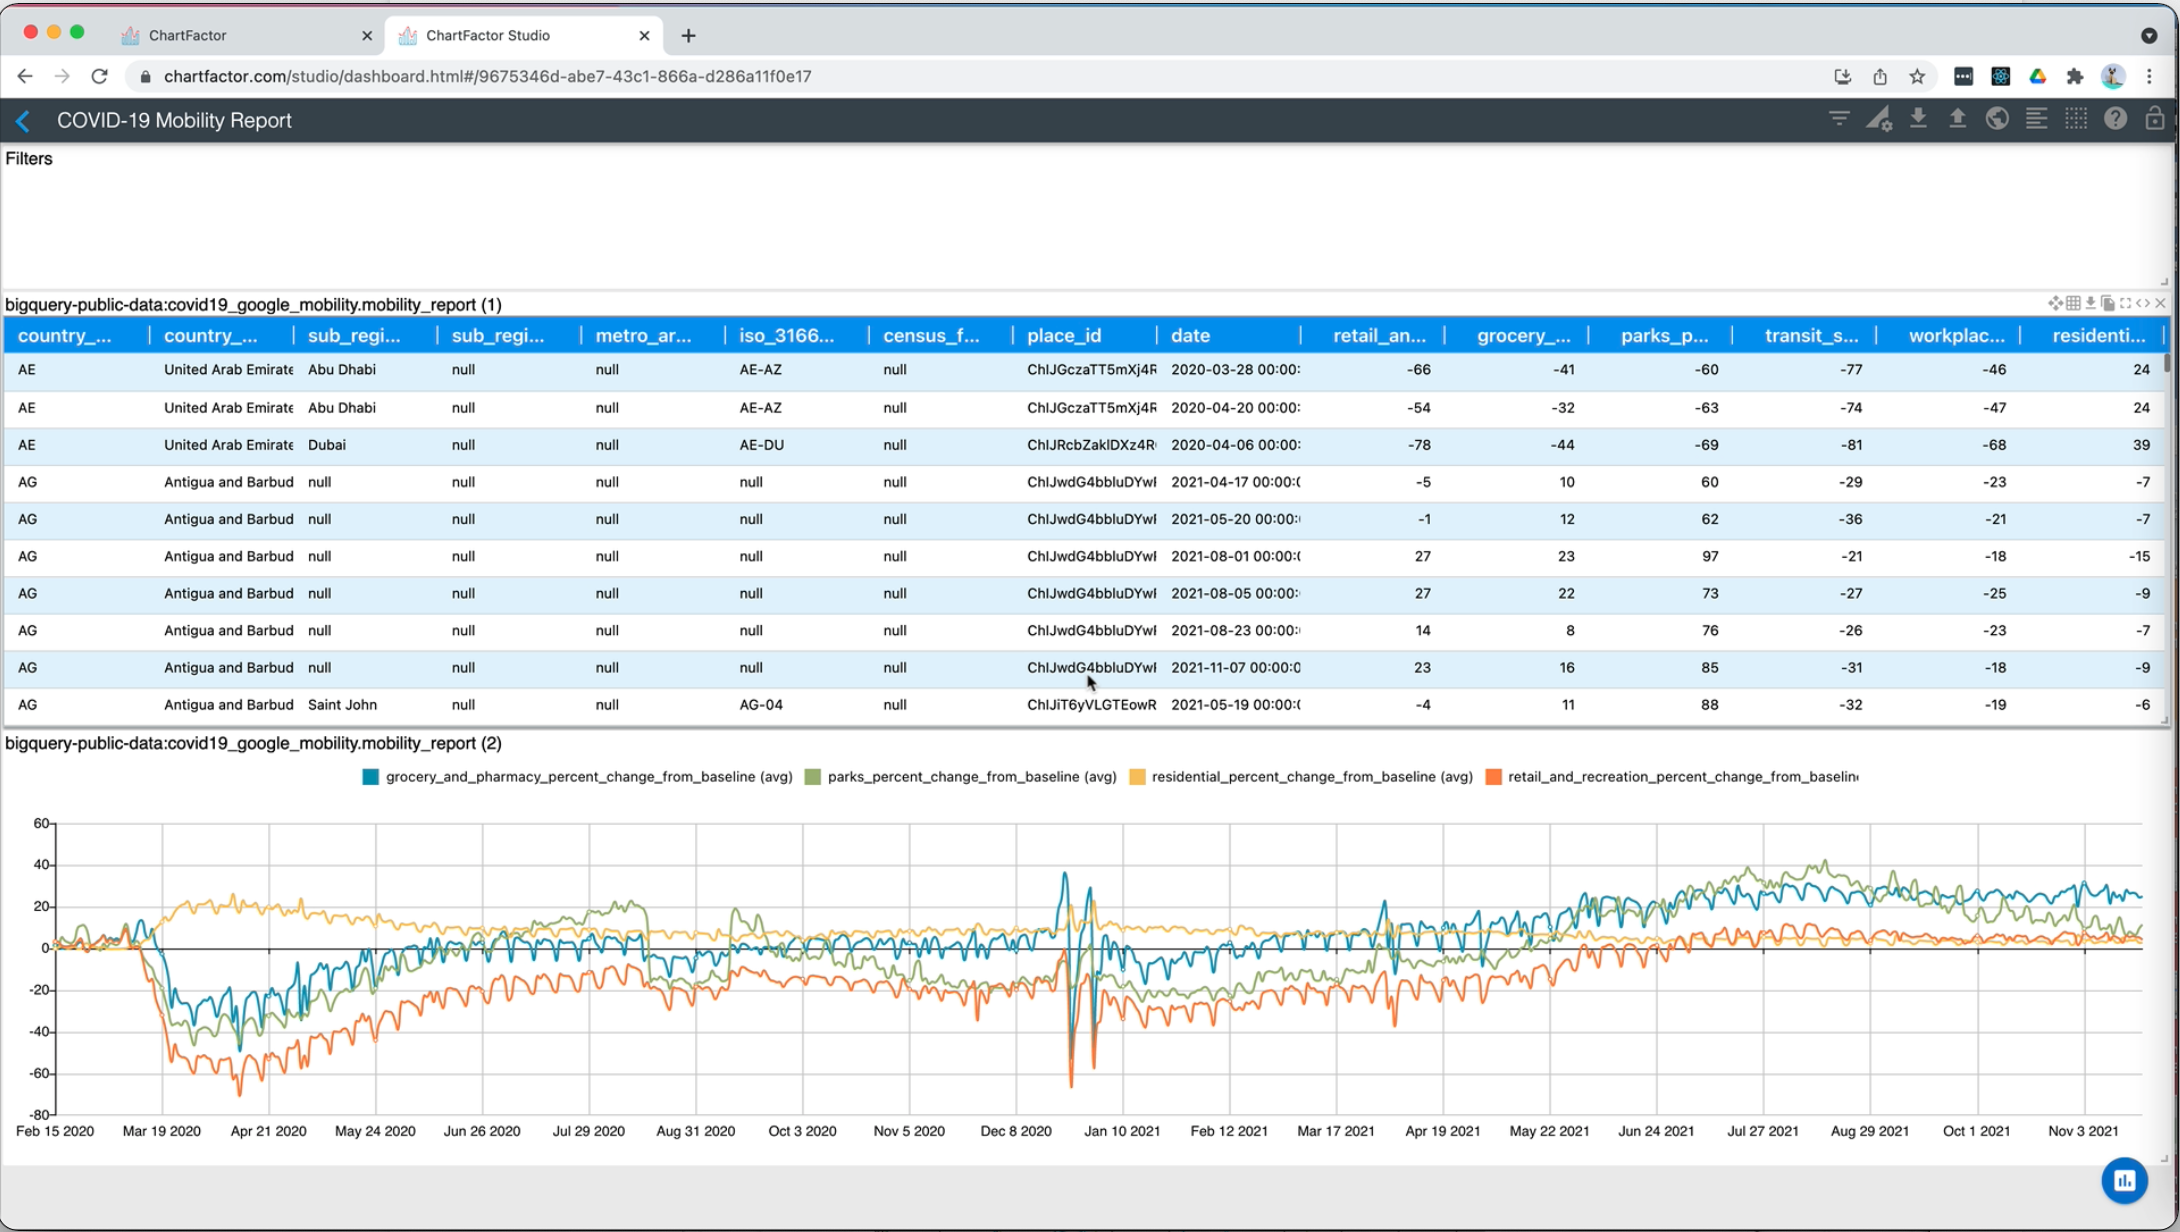
At this point, you should have an interactive dashboard as the one shown below. You should be able to select columns and filter them as needed.
-
Now let’s generate your web application. Click on the "Generate web app" icon on the top right on the screen.
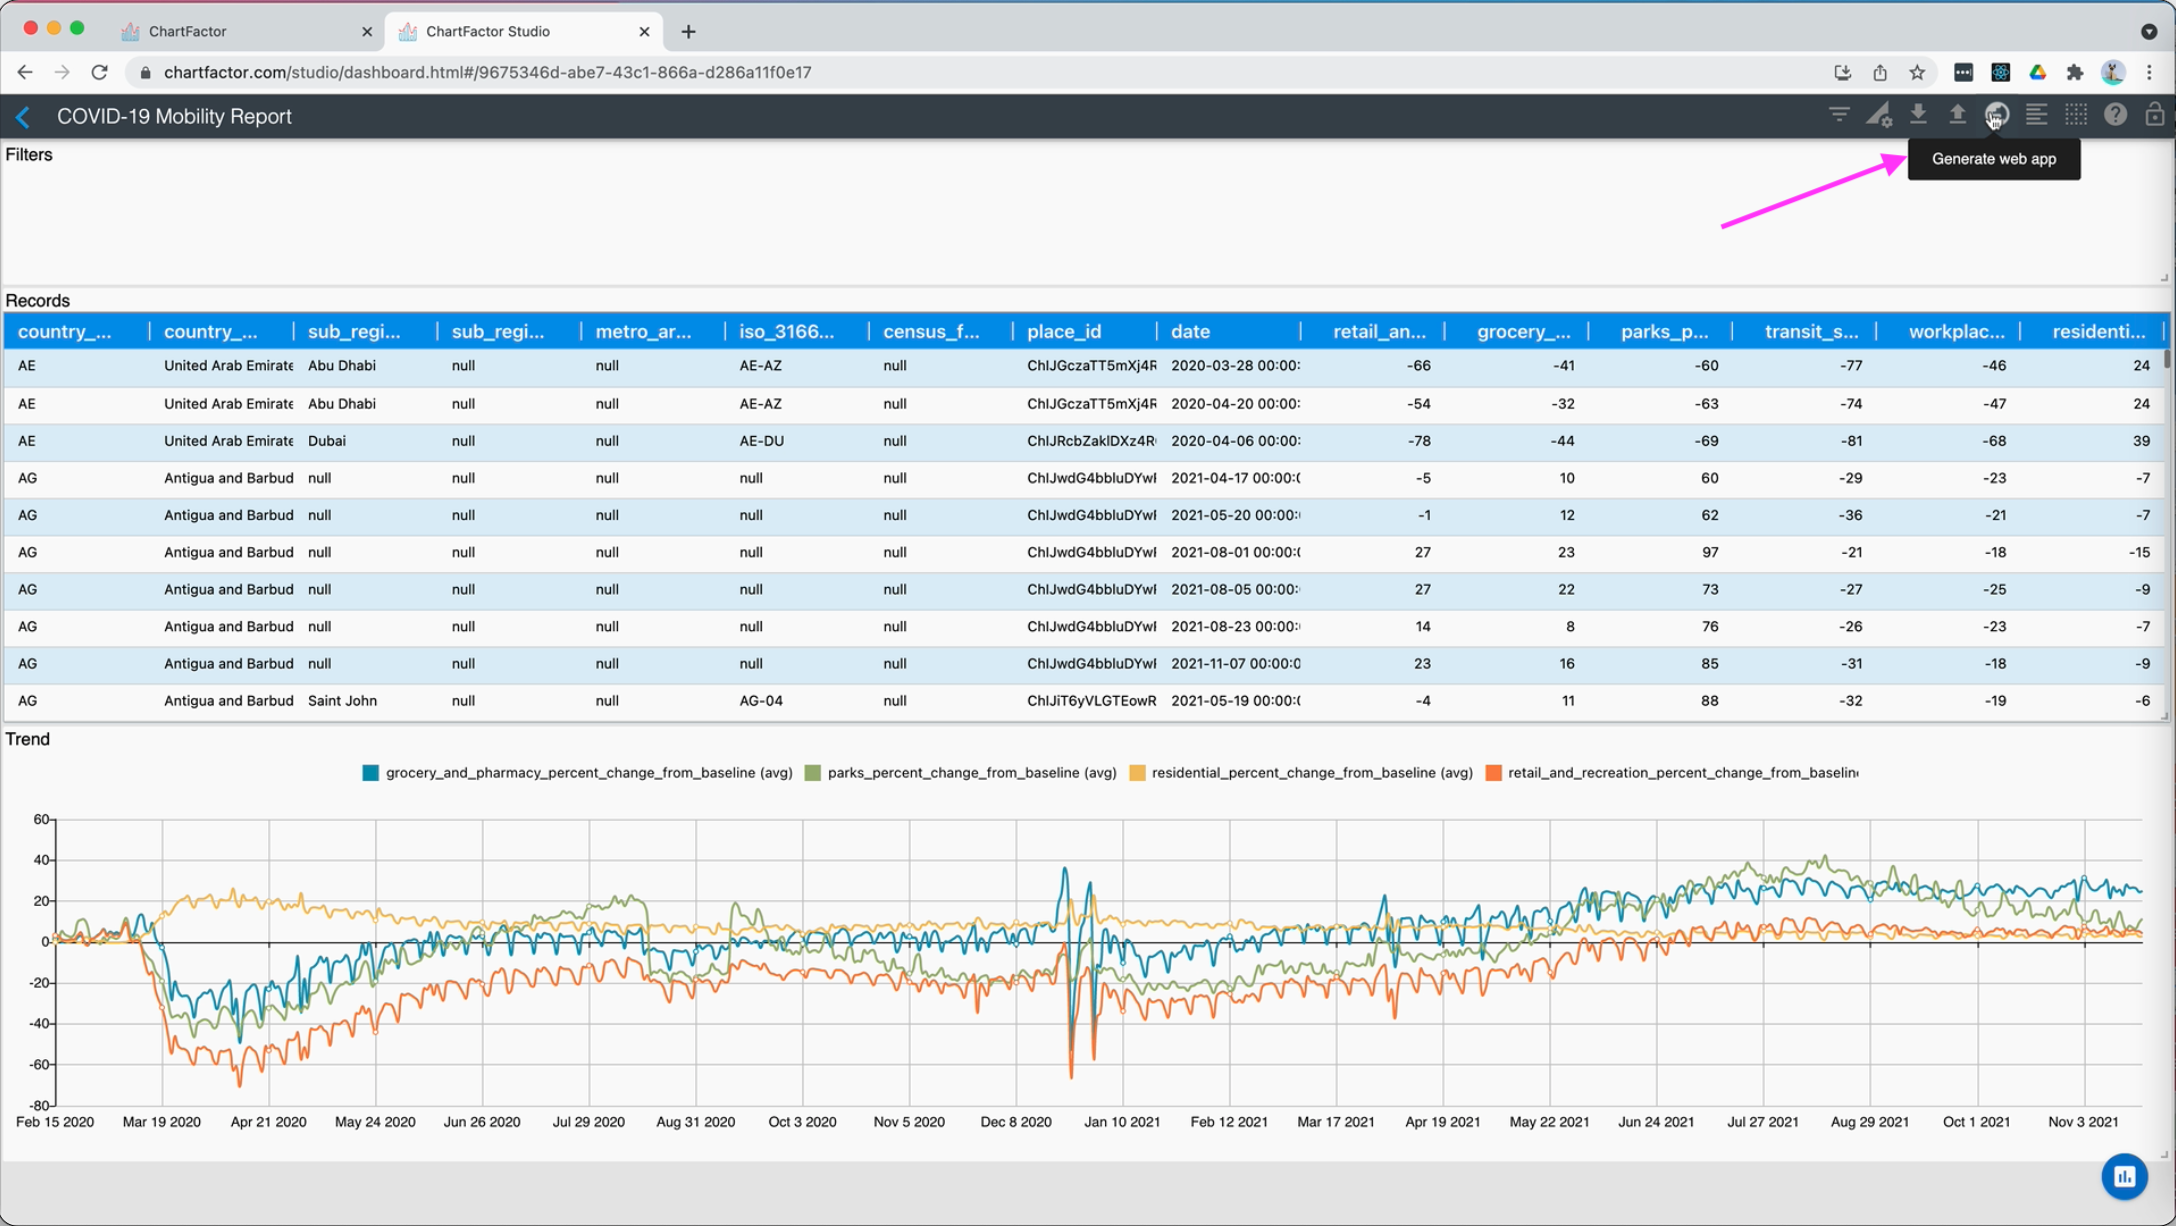
-
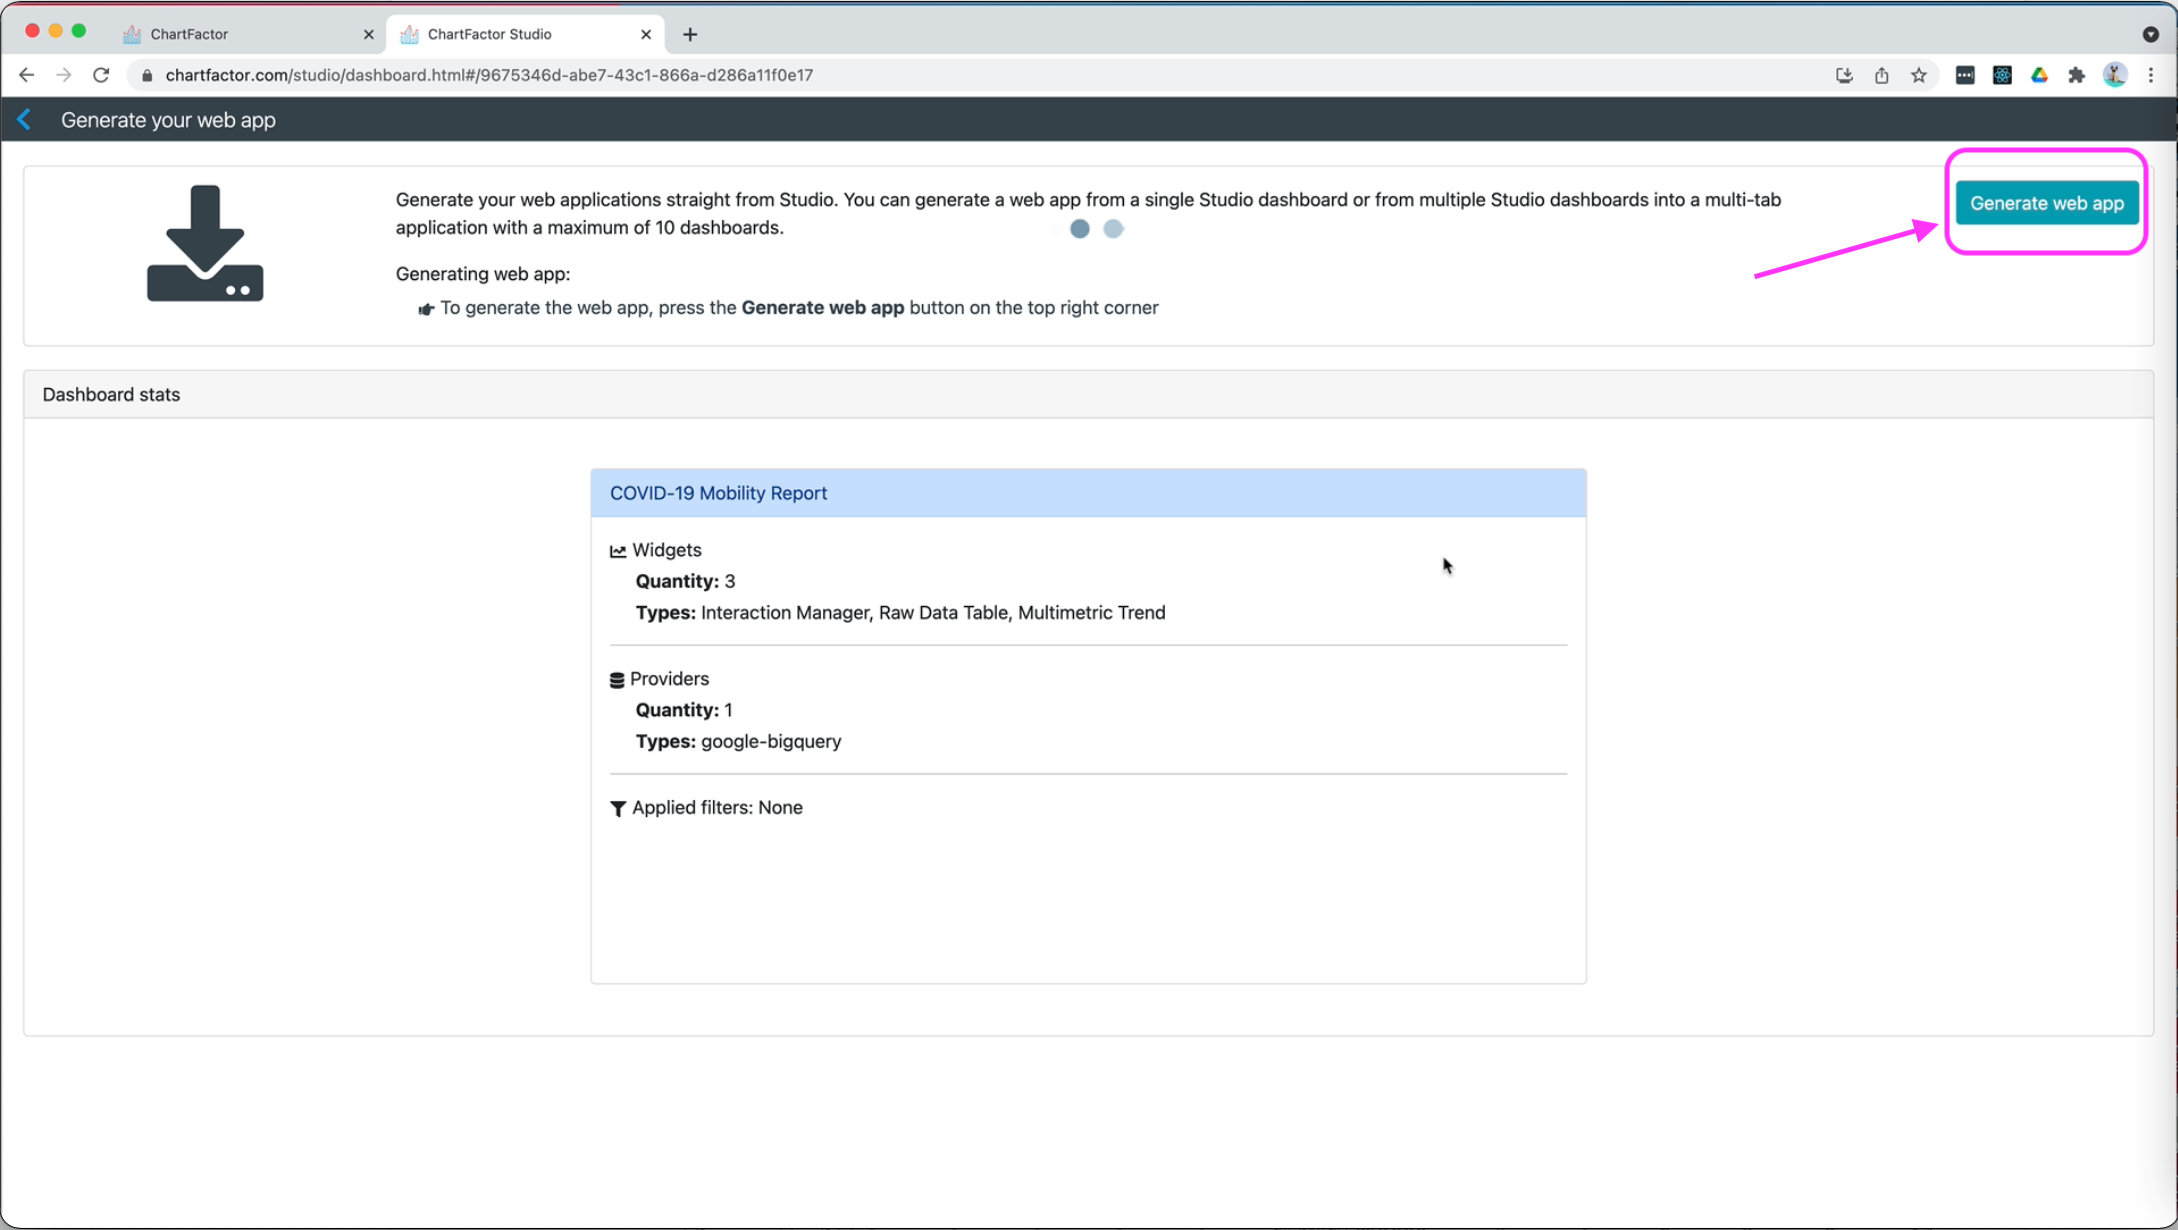
Now select the "Generate web app" button
-
Depending on your browser settings, the generated application will download directly to your Downloads folder or it may ask you for a location where to download your generated file. In my case, I am asked to select the location. I select the “Downloads” folder and save.
-
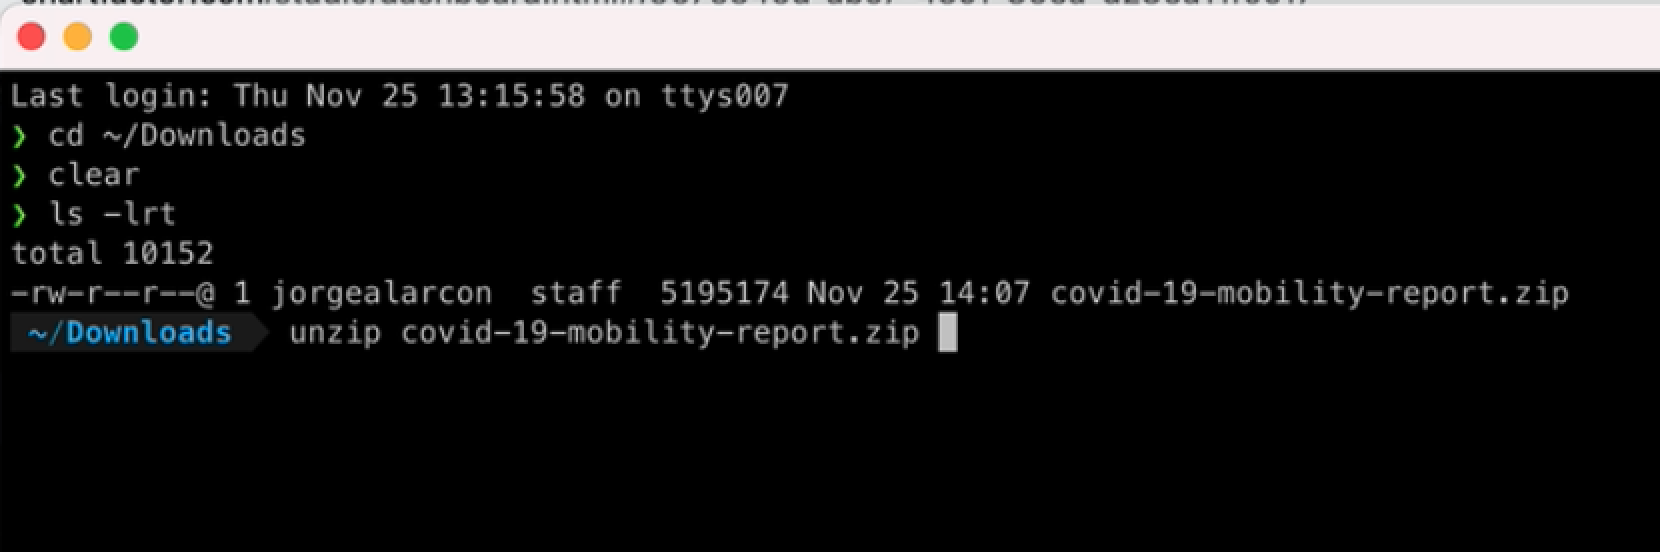
Now, open a Terminal window, move to the folder where you downloaded the application (e.g. Downloads folder) and use the unzip command in Mac to unzip the file. Use an equivalent command in Windows.
-
Now let’s start a web server to test your new app. If you have python3 installed, you can start a web server by typing the command below where 8080 is the port number.
1python3 -m http.server 8080 -
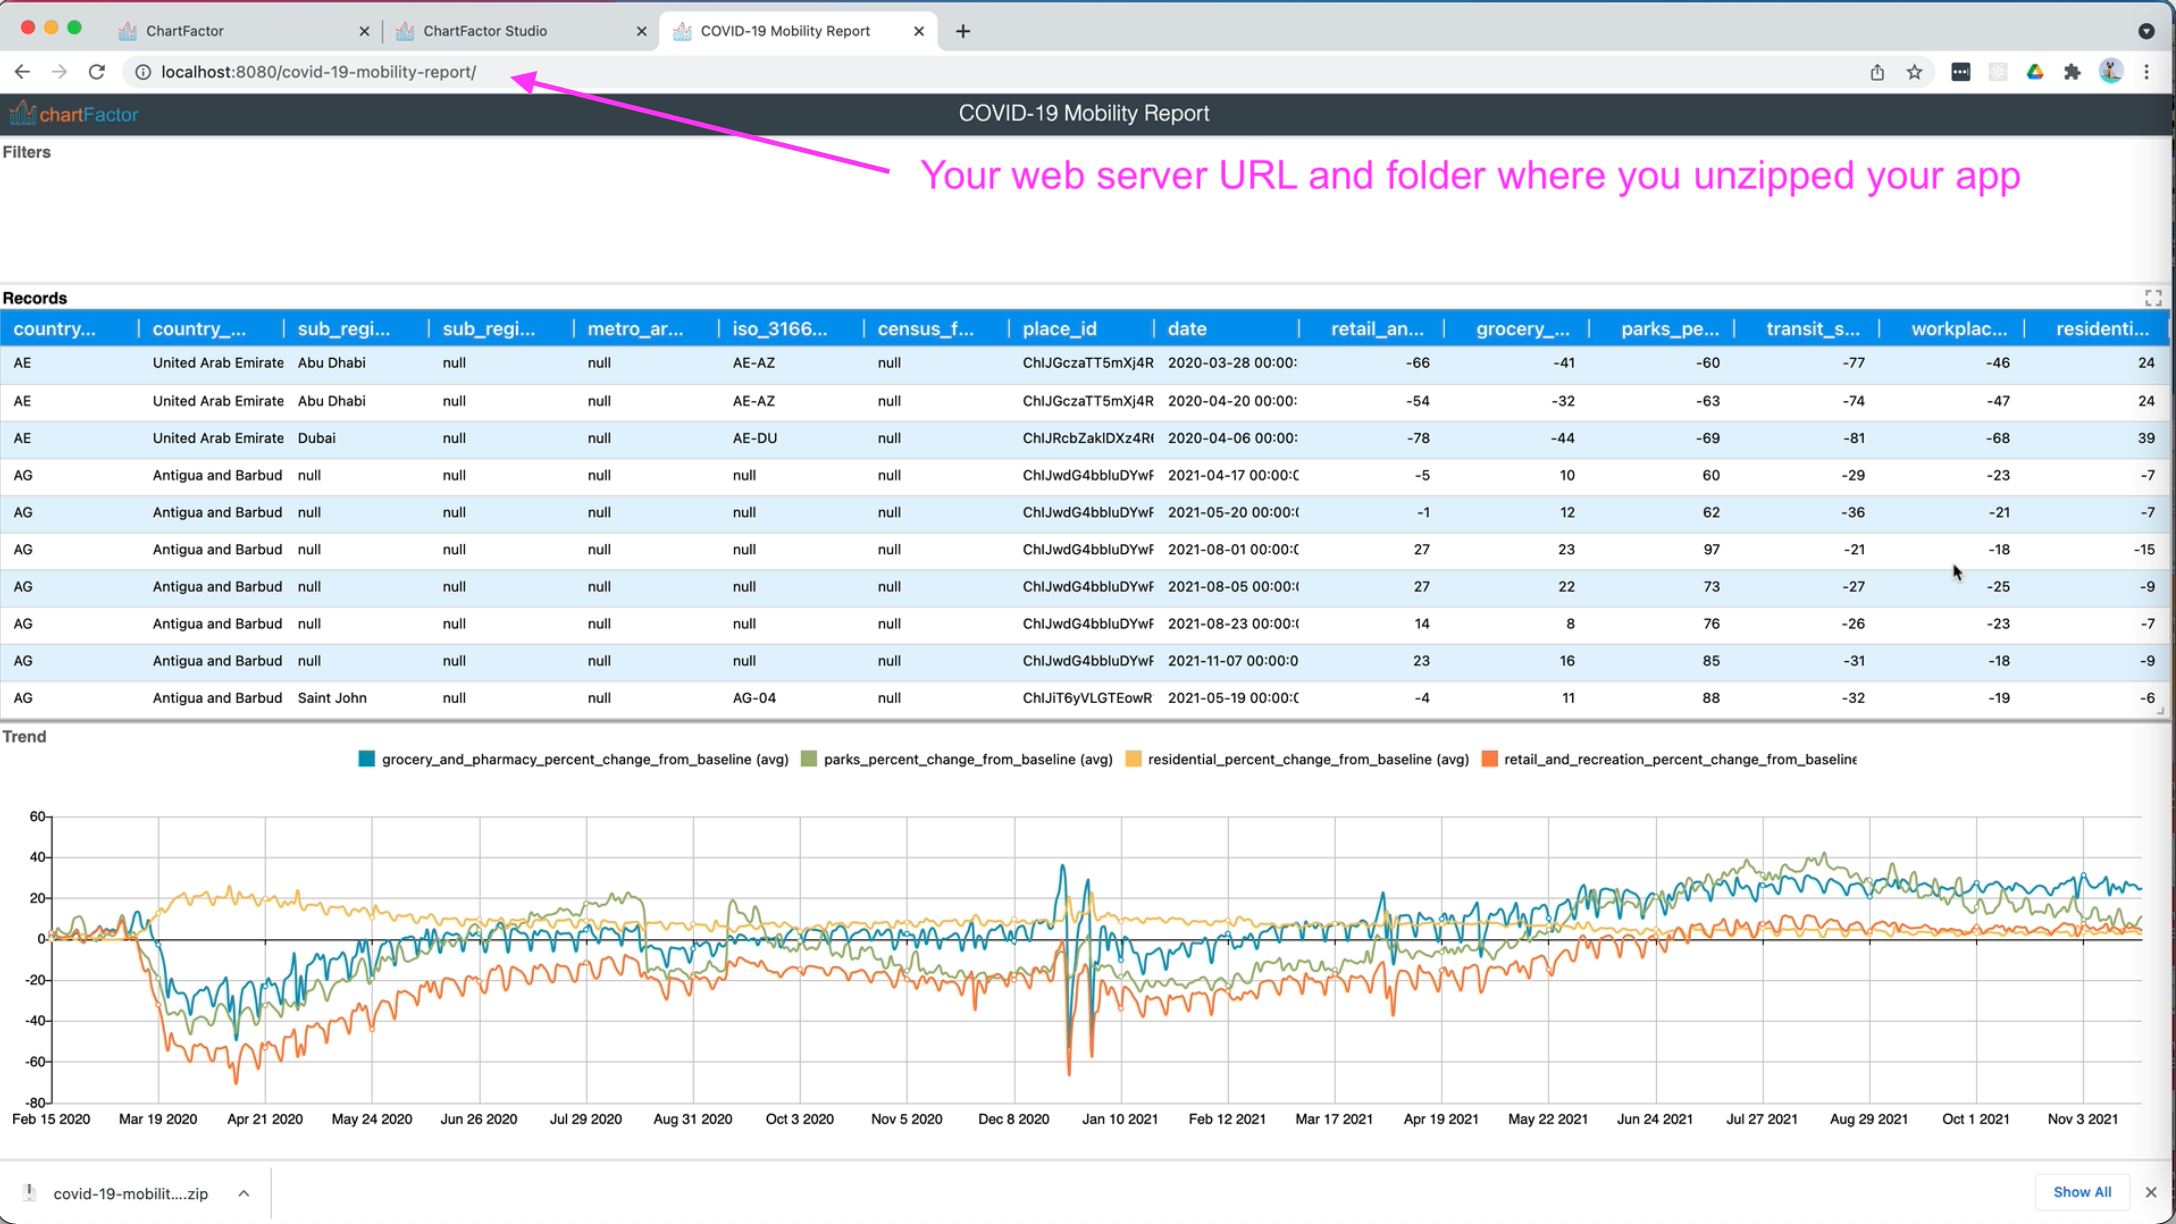
Open a browser tab, open your web server URL and navigate to the folder where you unzipped your application.
-
Your web data application is now deployed and ready for users to explore and interact with the COVID-19 Mobility Report data.
-
END