Sankey Diagram
Sankey diagrams are a specific type of flow diagram, in which the width of the arrows is shown proportionally to the flow quantity.
Creating a Sankey Diagram
Using a pivot Query
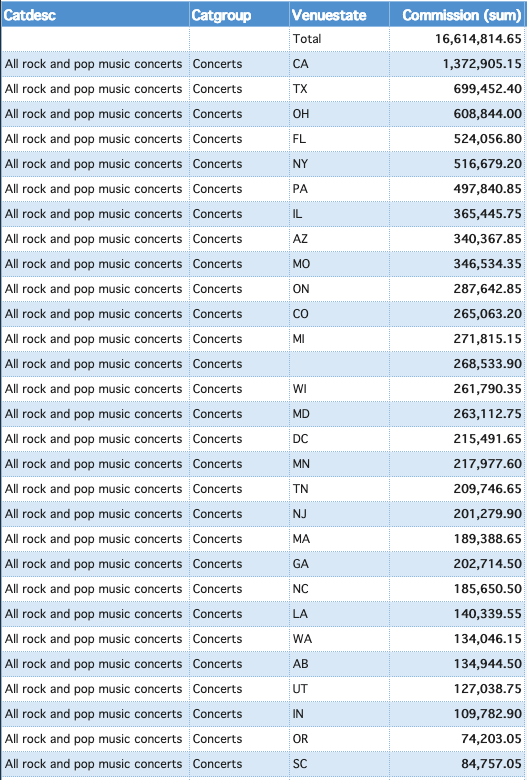
The simplest way to make a Sankey Diagram is through a Pivot Query, imagine that we have the following Pivot Table:
 1
 2
 3
 4
 5
 6
 7
 8
 9
10
11
12
13
14
15
16 | let provider = cf.provider("elastic");
let source = provider.source('ticket_sales');
// Add Metrics
let metricCount = new cf.Metric("count");
// Add fields to data source.
let myData = source
// Rows
.rows("catdesc.keyword", "catgroup.keyword", "venuestate")
// Columns
.columns()
// Metrics
.metrics(metricCount);
// Define chart options
let myChart = myData.graph("Pivot Table")
.element('chart')
.execute();
|
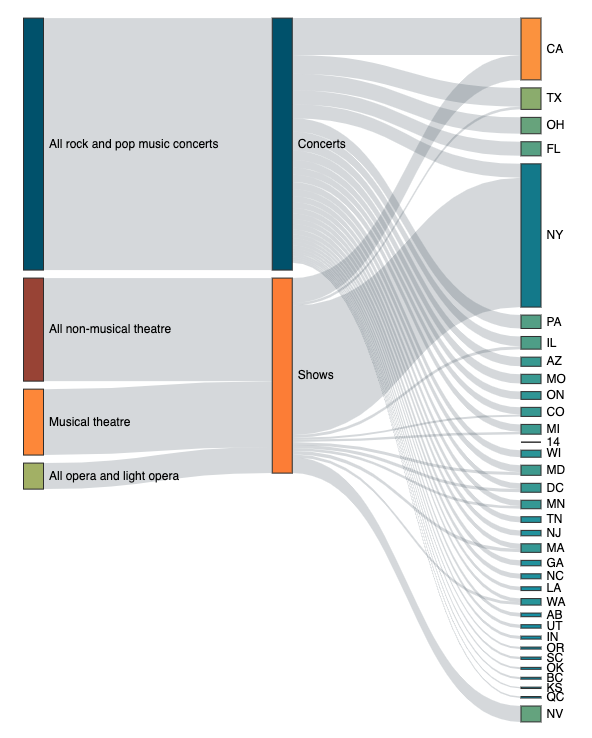
A Sankey Diagram that represents the information of the previous Pivot Table could be achieved with the following code:
 1
 2
 3
 4
 5
 6
 7
 8
 9
10
11
12
13 | let provider = cf.provider("elastic");
let source = provider.source('ticket_sales');
// Define metrics
let metric0 = cf.Metric("count");
let myData = source
// Rows
.rows("catdesc.keyword", "catgroup.keyword", "venuestate")
// Metrics
.metrics(metric0);
// Define chart options
let myChart = myData.graph("Sankey")
.element('chart')
.execute();
|
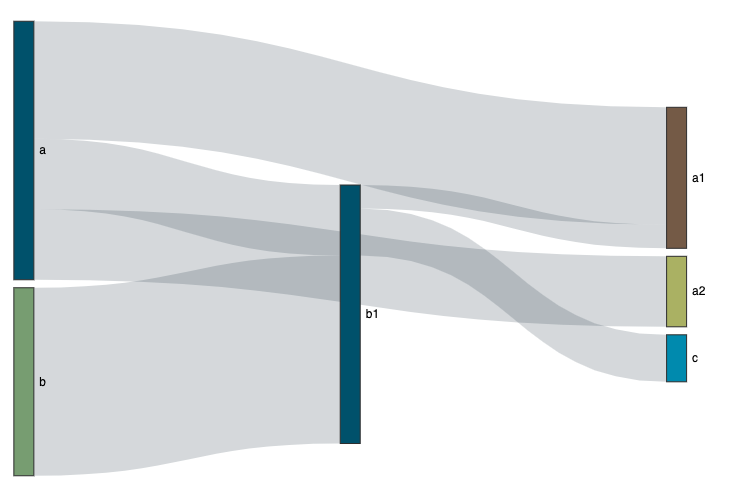
Using static data
If you need to create a Sankey Diagram with local information you can do it in the following way:
 1
 2
 3
 4
 5
 6
 7
 8
 9
10
11
12
13
14
15
16
17
18
19
20
21
22
23
24
25
26
27
28
29
30
31
32
33
34
35
36
37
38
39
40
41
42
43
44
45
46 | let data = {
nodes: [{
name: 'a'
}, {
name: 'b'
}, {
name: 'a1'
}, {
name: 'a2'
}, {
name: 'b1'
}, {
name: 'c'
}],
links: [{
source: 'a',
target: 'a1',
value: 5
}, {
source: 'a',
target: 'a2',
value: 3
}, {
source: 'b',
target: 'b1',
value: 8
}, {
source: 'a',
target: 'b1',
value: 3
}, {
source: 'b1',
target: 'a1',
value: 1
}, {
source: 'b1',
target: 'c',
value: 2
}]
};
let myChart = cf.create()
.data(data)
.graph('Sankey')
.element('chart')
.execute();
|
Using multiples queries
You can create a Sankey Diagram with multiple queries, one to retrieve the information from the connections and the other to retrieve the information from the nodes, as follows:
 1
 2
 3
 4
 5
 6
 7
 8
 9
10
11
12
13
14
15
16
17
18
19
20
21
22
23
24
25
26
27
28
29
30
31
32
33
34
35
36
37
38
39
40
41
42
43 | let nodesHandler = function (result) {
result.data.nodes.forEach(x => {
x.name = x.id; // is mandatory that the nodes have a name
delete x.id;
delete x.rn;
});
result.keep = true;
result.custom = true;
return result;
};
let edgesHandler = function (result) {
let nodes = [];
result.data.links.forEach(x => {
if (nodes.indexOf(x.source) === -1) nodes.push(x.source);
if (nodes.indexOf(x.target) === -1) nodes.push(x.target);
x.value = 1;
delete x.rn;
});
result.filters = (nodes && nodes.length > 0) ? [cf.Filter('id').values(nodes)] : [];
return result;
};
let myChart = cf.create('links')
.provider('Elasticsearch')
.source('npmdepgraph-links')
.fields('source', 'target')
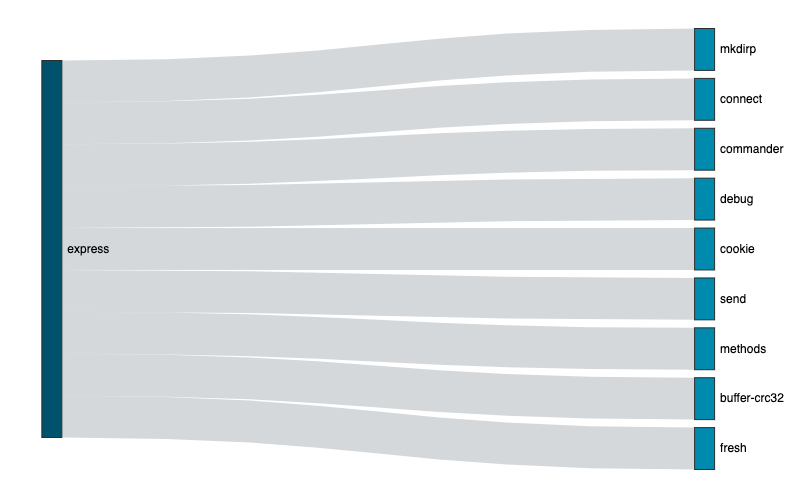
.filters(cf.Filter('source').values(['express']))
.processWith(edgesHandler.bind(this))
.create('nodes')
.provider('Elasticsearch')
.source('npmdepgraph-nodes')
.fields('id')
.processWith(nodesHandler.bind(this))
.graph('Sankey')
.on('click', (x) => {
console.log(x);
})
.element('chart')
.execute();
|
Note
When using the multi-query option in the Sankey Diagram, the Interaction Manager (if present) does not trigger filters automatically when users select Sankey nodes as it does with the pivot query version. To tigger filters, add an event handler for the click event.
Settings
hoverFocus
When users hover over a node or edge, adjacent nodes and edges can also be highlighted using the hoverFocus setting. The default value is false. Possible values are:
-
false: When hovering over a node or an edge, only the hovered node or edge is highlighted
-
true: the same as 'allEdges'
-
allEdges: When hovering over a node, all of the adjacent edges and nodes are highlighted. When hovering over an edge, the adjacent nodes are highlighted
-
outEdges: When hovering over a node, the outcoming edges and its adjacent nodes are highlighted. When hovering over an edge, the adjacent nodes are highlighted
-
inEdges: When hovering over a node, the incoming edges and its adjacent nodes are highlighted. When hovering over an edge, the adjacent nodes are highlighted
The sample code below uses the hoverFocus set to true:
 1
 2
 3
 4
 5
 6
 7
 8
 9
10
11
12
13
14
15
16
17
18 | let provider = cf.provider("Elasticsearch");
let source = provider.source('ticket_sales');
//Configuration for grid
let grid = cf.Grid().left(40).right(40).bottom(10).top(0);
// Define metrics
let metric0 = cf.Metric("commission","sum");
let myData = source
// Rows (do not remove this line)
.rows("catgroup.keyword", "catdesc.keyword", "venuestate")
// Metrics (do not remove this line)
.metrics(metric0);
// Define chart options
let myChart = myData.graph("Sankey")
.set("grid", grid)
.set("hoverFocus", true)
.limit(10000)
.element('chart')
.execute();
|
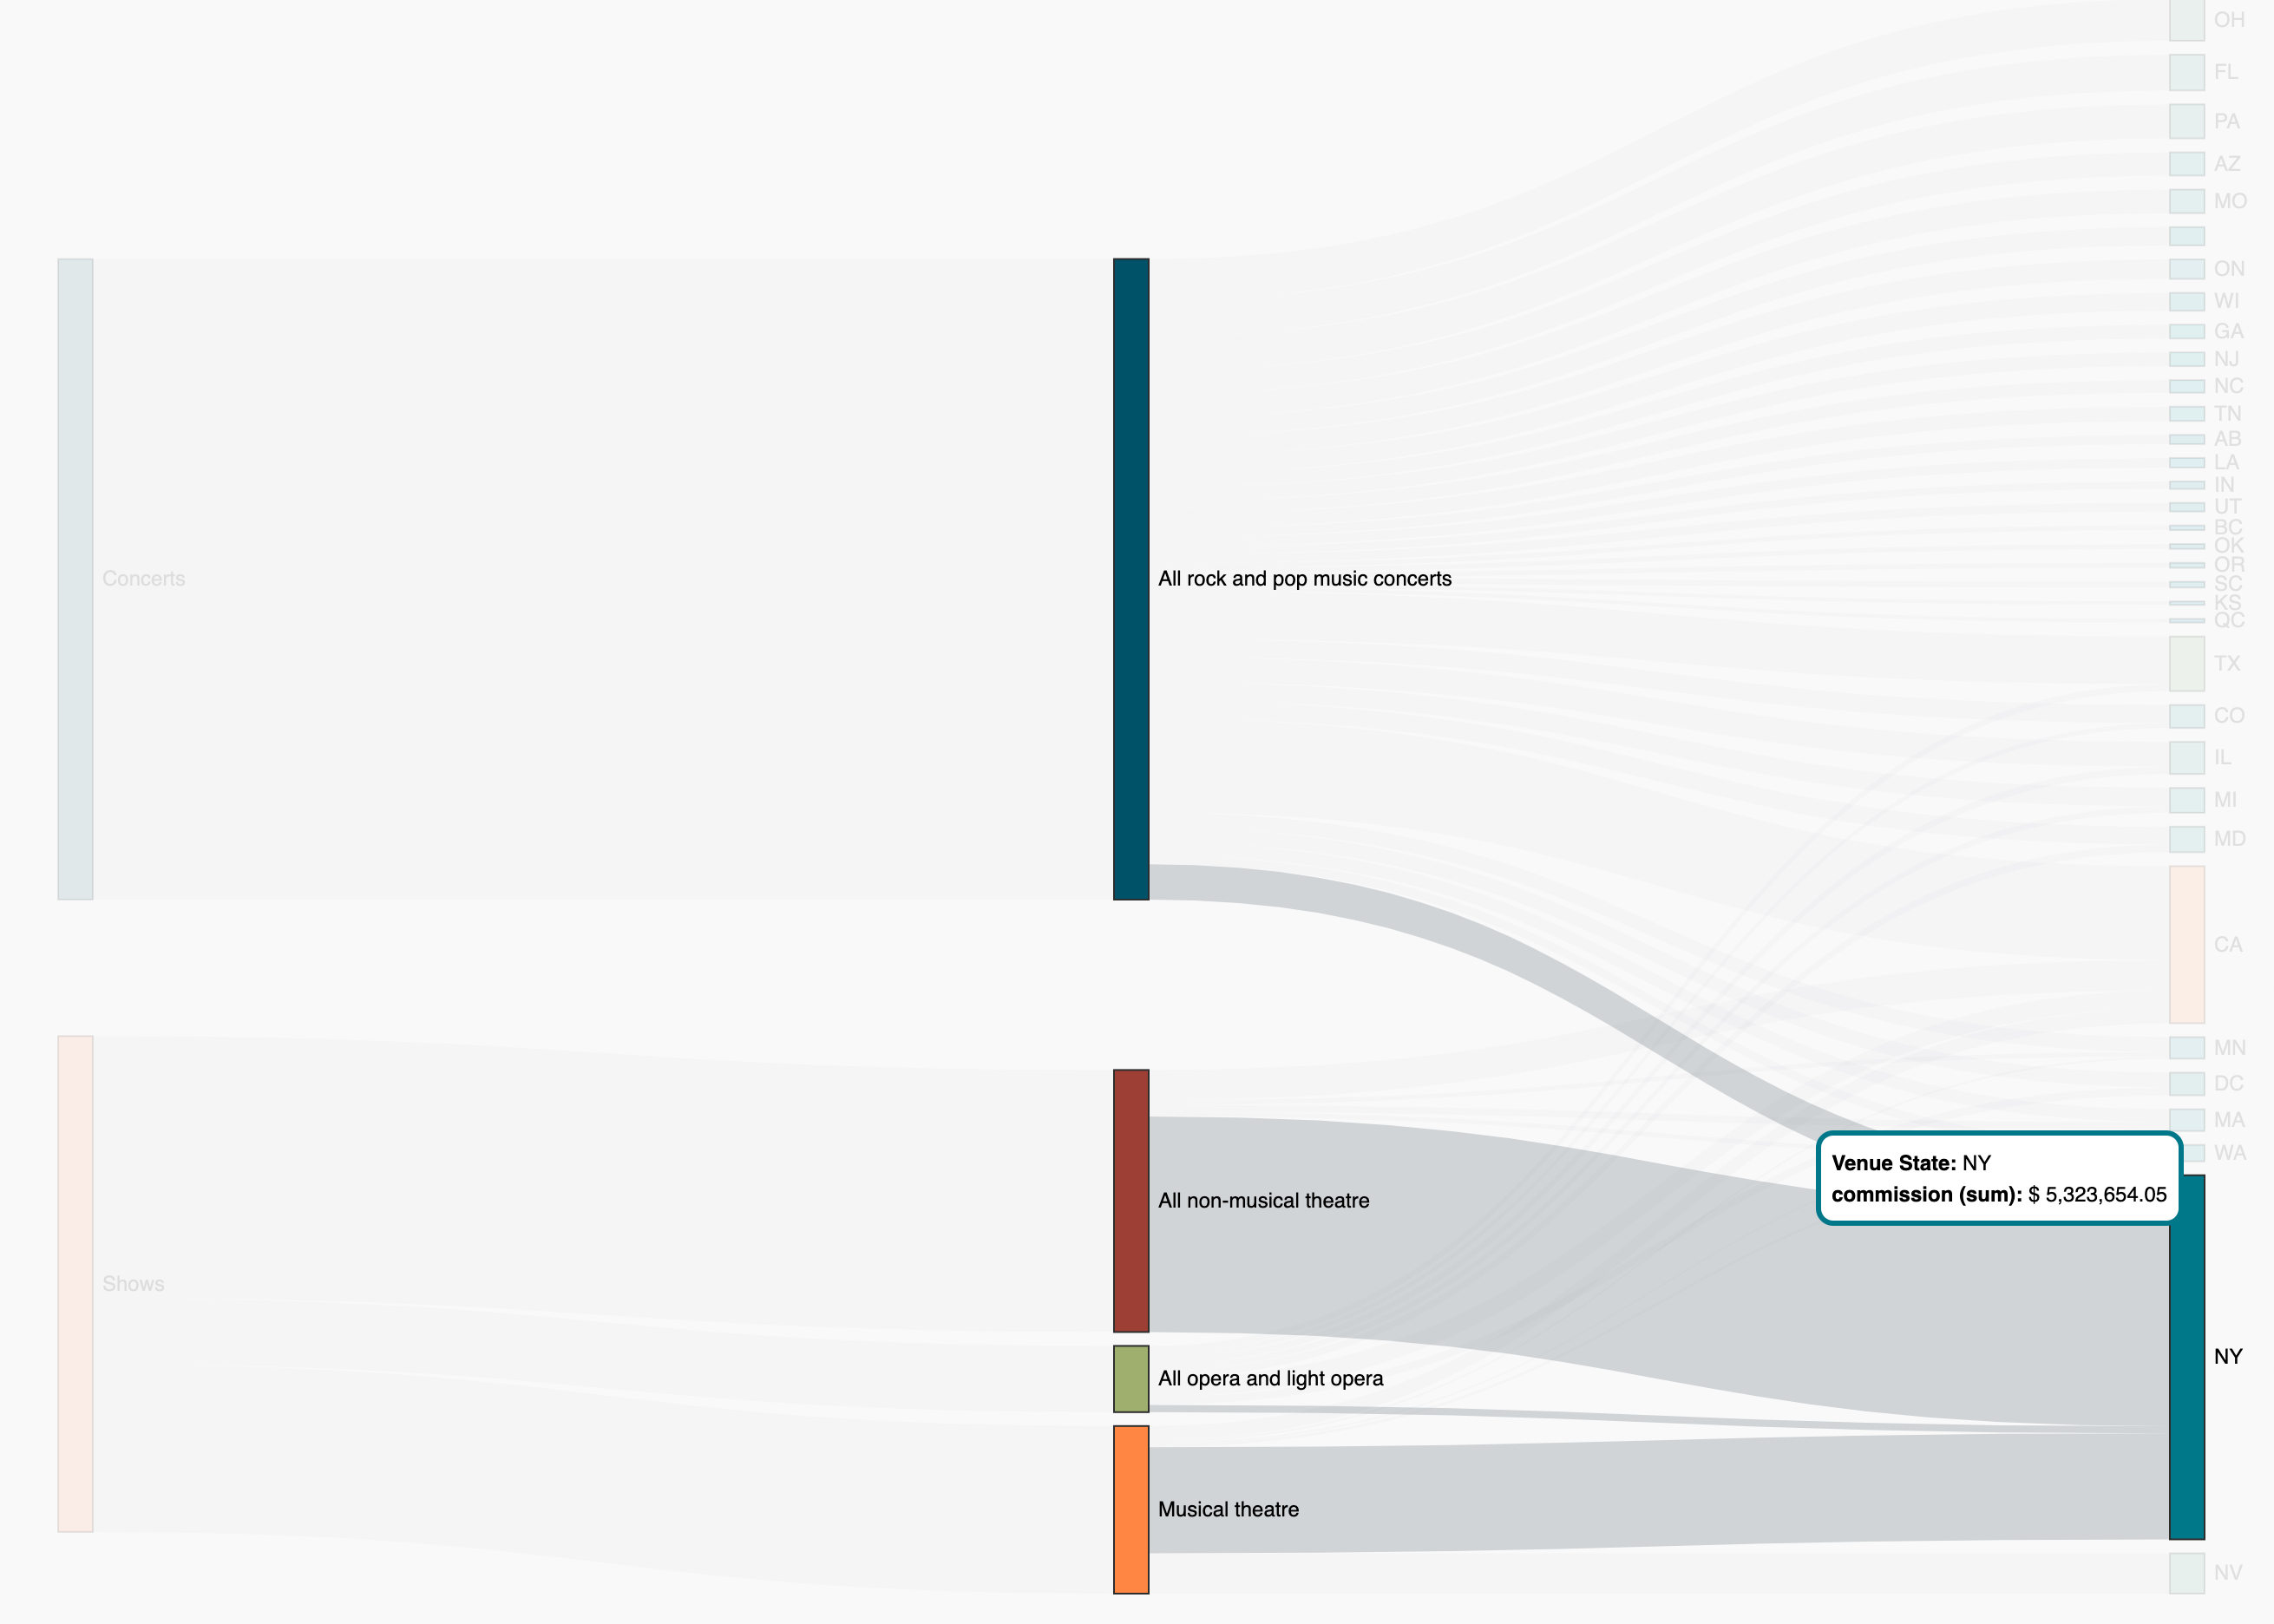
When users hover on the NY Venue State, the Sankey diagram would highlight the nodes and edges as shown below.