Tree
Tree is a multigroup chart useful to visualize hierarchical data. ChartFactor toolkit allows to define a Tree chart in the following way:
1 2 3 4 5 6 7 8 9 10 11 12 13 14 15 16 17 18 19 20 21 22 23 24 25 | |
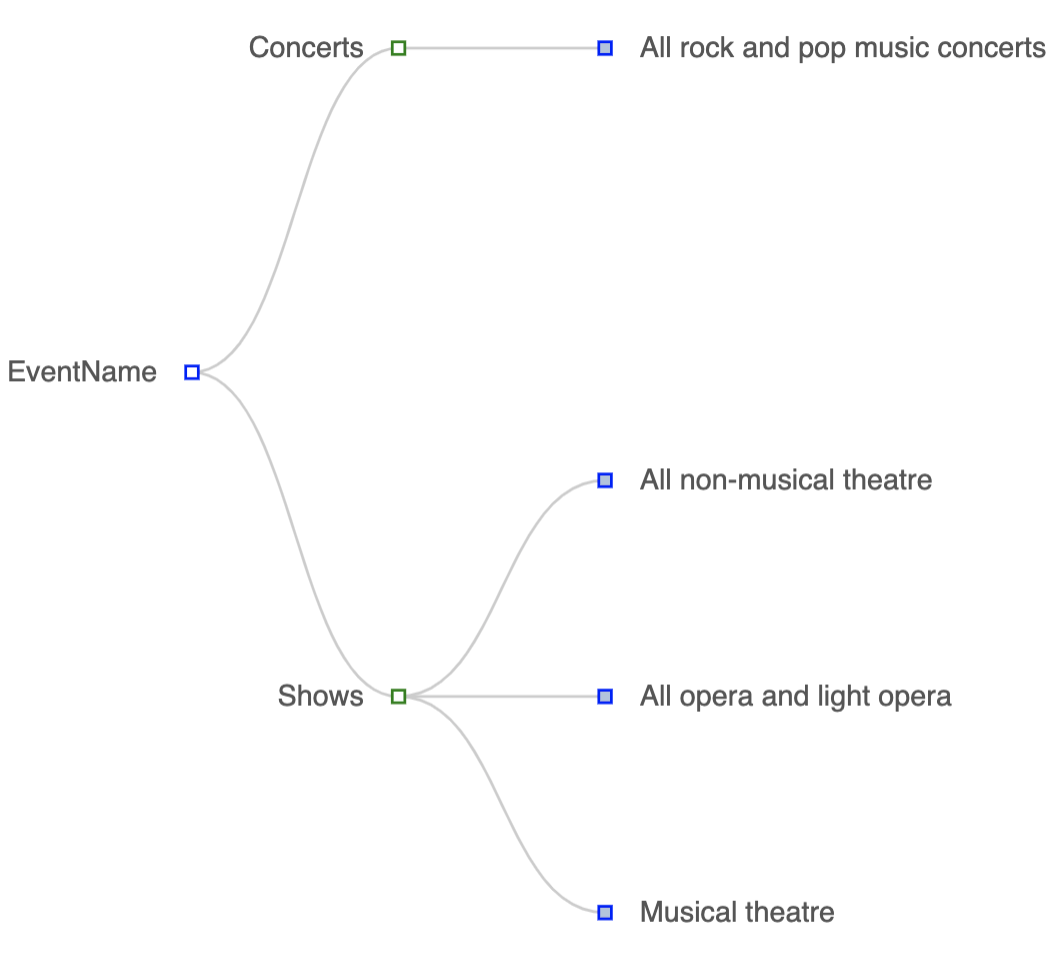
The previous code will render the Tree Chart below:
Tree configuration
The Tree chart supports multiple options to change its rendering behavior. The following are the supported settings:
-
rootLabel: This option defines the name of the parent node. The parent node is the first node or item the user sees when the chart is rendered.
-
layout: This option defines how the chart will render. It can be
orthogonalorradial. The orthogonal layout is what we usually refer to the horizontal and vertical direction. The radial layout refers to the view where the root node is at the center and each layer of nodes are rendered as rings. -
orientation: This option defines the direction of the orthogonal layout in the tree. This configuration takes effect only when you use
.set('layout', 'orthogonal')or when you don't set the layout property since its default is orthogonal. The corresponding directions arefrom left to right, from right to left, from top to bottom, from bottom to top, with shorthand values'LR', 'RL', 'TB', 'BT'. -
deep: This option defines the initial depth of the tree. This configuration is primarily used in conjunction with the
expandableoption. It allows users to set the initial depth of nodes the tree will render. -
expandable: This option defines if a you can collapse or expand a subtree. The default value is true. If you change to false all the nodes will show when the tree is rendered and users can't collapse or expand subtrees.
-
symbol: This option defines the icon that represents a node inside the tree. Posible icons are:
'circle', 'rect', 'roundRect', 'triangle', 'diamond', 'pin', 'arrow', 'none'. If you add the stringemptybefore the icon name, for example'emptyDiamond', the tree chart fills the node icon with a gray color when it is collapsed and with a white color when you expand that node. -
symbolSize: This option defines the size of the node icon. The default value is 7.
-
labelSize: This option defines the font size for the node label. The default value is 12.
-
labelDistance: This option defines the distance between the node icon and the label description. The default value is 5.
-
labelRotate: This option define the rotation of the label if needed. This allows you to rotate the label from -90 degree to 90.
Hierarchical MultiGroup Data Structure
To visualize a Tree with a hierarchical multiGroup data structure you must define a pivot query with the hierarchical fields as shown in the example below:
1 2 3 4 5 6 7 8 9 10 11 12 13 | |
Note
The default result limit is 10000. You can change this value by using the .limit(x) function where x is the new limit.