Describing charts
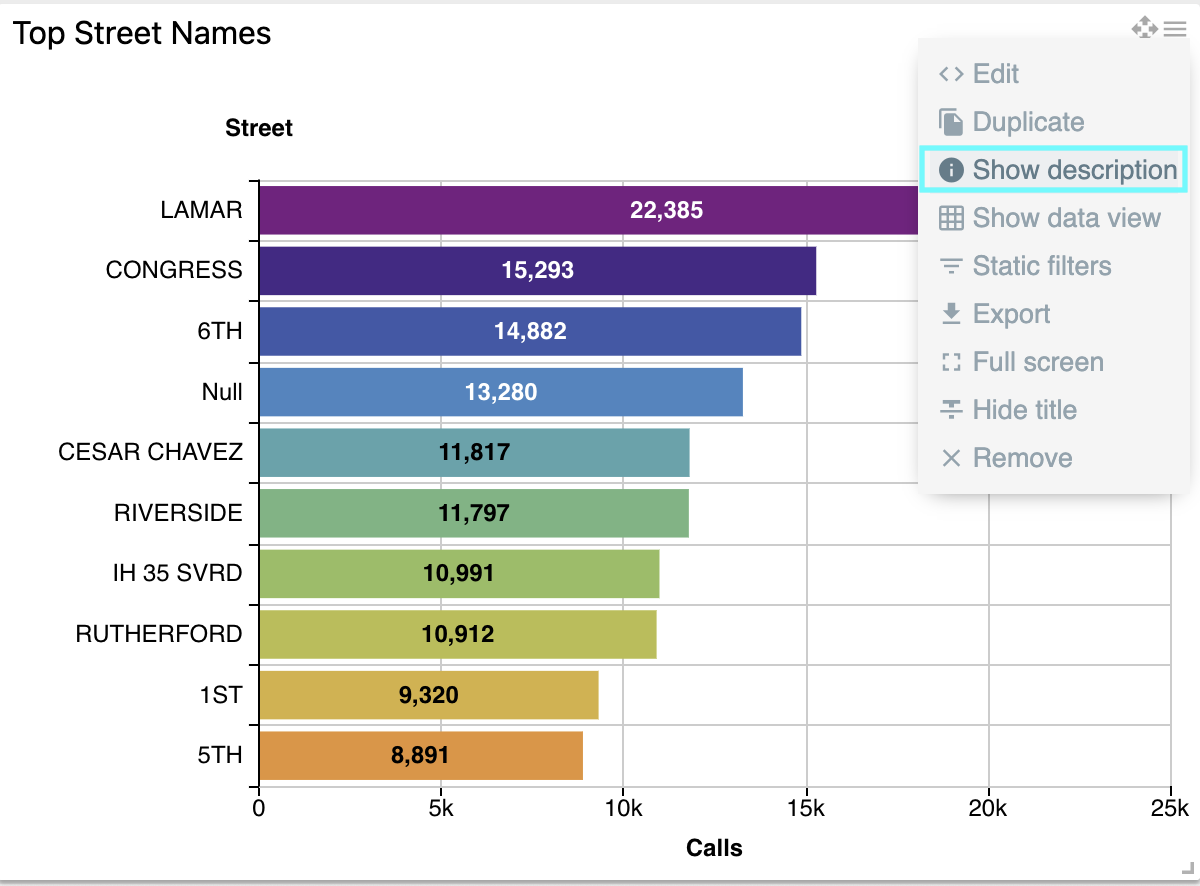
ChartFactor Studio allows you to provide descriptions for your charts. You can update your chart description by using the Show description option on the widget menu as shown below.
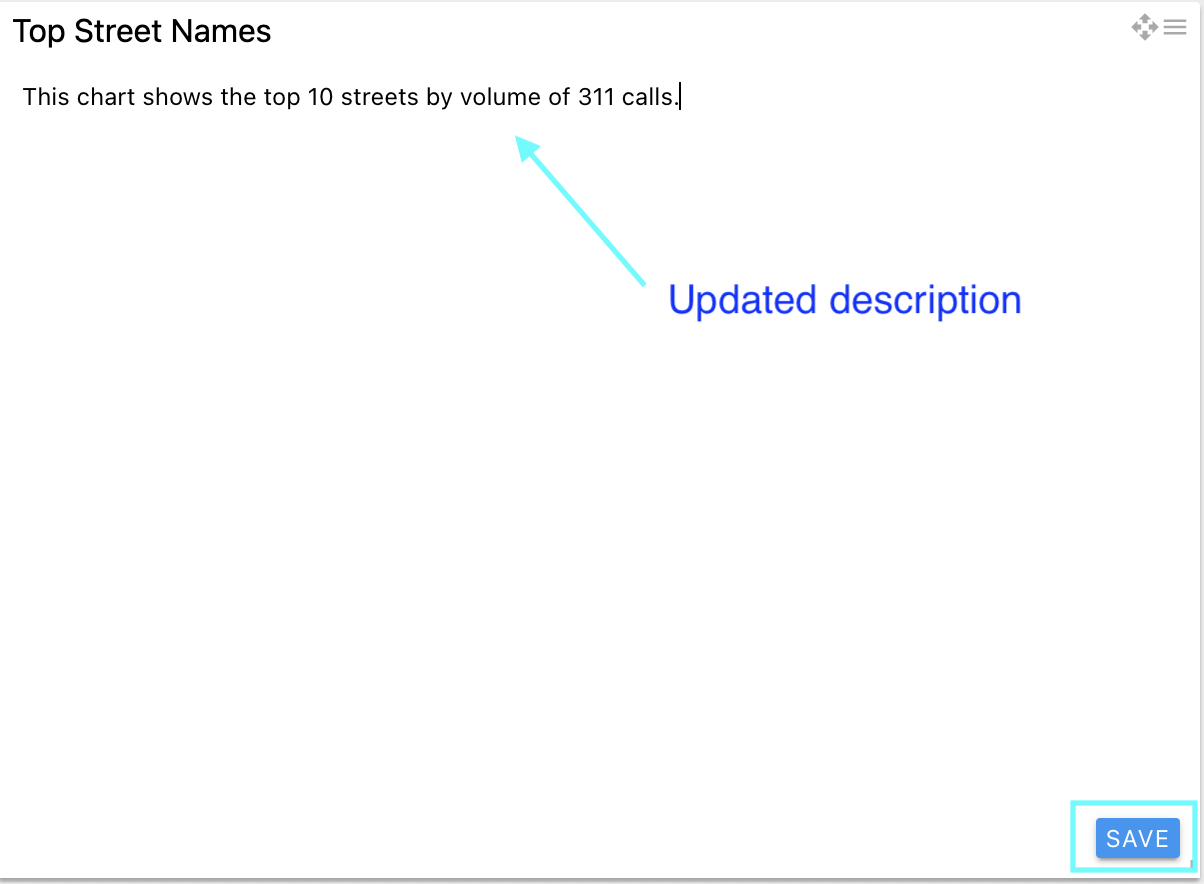
The chart description will show in view mode. To edit it, double-click on the description area. Once you are done updating it, select the Save buton as shown below.
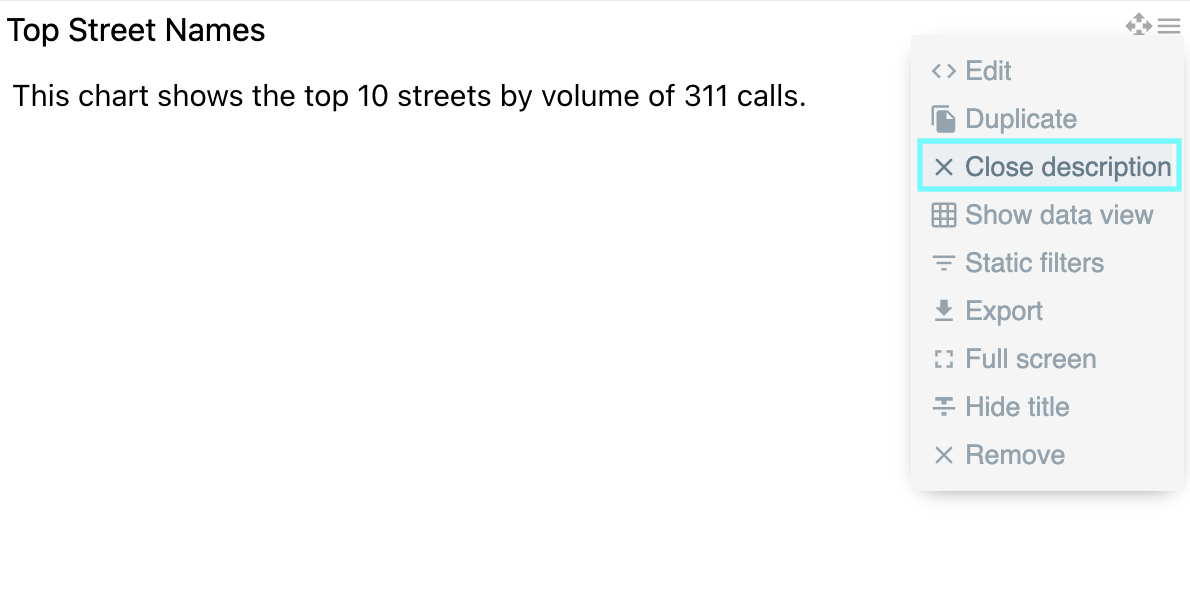
After saving, your chart description will go back to view mode. You can use the Close description option on the widget menu to go back to viewing your chart. See below.
Tip
When the chart is AI-generated, the chart description will also be AI-generated. You can update these descriptions as usual.