Skip to content

Sunburst

Sunburst is a spatial visualization that is useful when hierarchical data is available. It supports the data structures below.

Parent-Child Data Structure

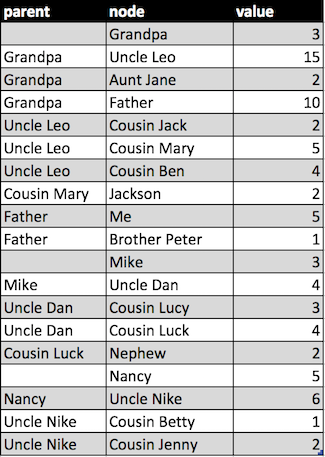
The data source must have a unique node identifier and the identifier of the parent node in each input.

Example input Data:
SB

To visualize a Sunburst with a Parent-Child Data Structure, the first group of the query must be the field that contains the identifier of the parent node and the second group must be the identifier of the node, as you can see in the example below:

 1
 2
 3
 4
 5
 6
 7
 8
 9
10
11
12
13
14
15
16
17
18
19
20
21
22
23
24
25
26
27
28
29
30
31
// Define the metrics to be used
let metrics = [];
let metric = cf.Metric('value', 'avg');
// const countMetric = cf.Metric('count');

// define attribute to group by
let groups = [];
let group = cf.Attribute('parent')
                .limit(50)
                .sort('asc', 'parent');
let group2 = cf.Attribute('node')
                .limit(50)
                .sort('asc', 'node');

metrics.push(metric);
// metrics.push(countMetric);
groups.push(group);
groups.push(group2);

let color = cf.Color().theme('dark');
// let grid = cf.Grid().left(0).top(10).bottom(110).right(120); 

let myChart = cf.provider('Elasticsearch')
                .source('family')
                .groupby(...groups)
                .metrics(...metrics)
                .graph('Sunburst')
                .set('legend', 'right')
                // .set('grid', grid)
                .set('color', color)
                .element('chart');

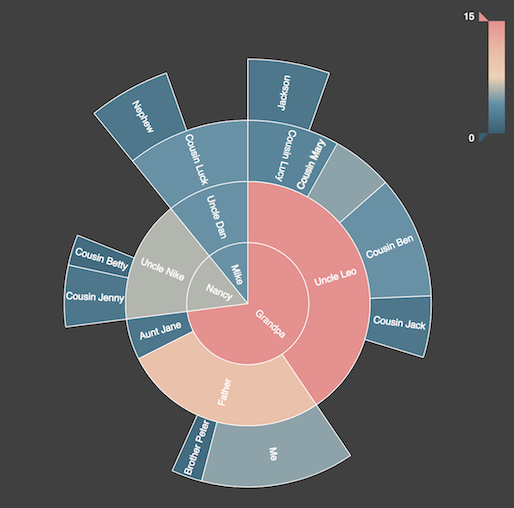
The previous code will render the Sunburst Chart below:
SB1

Hierarchical MultiGroup Data Structure

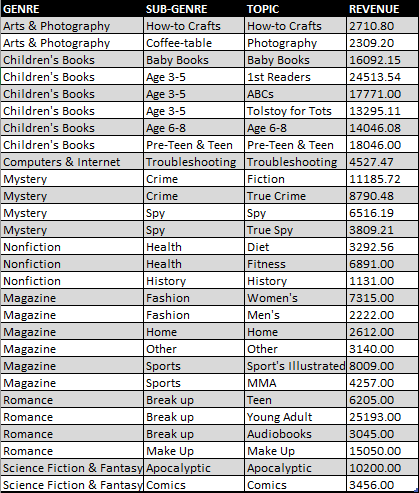
The data source must have multiple columns where column n + 1 is child of column n. An example of this data structure is below:
SB T

To visualize a Sunburst with a Hierarchical MultiGroup Data Structure you must define a pivot query where the rows are the different nested columns, as you can see in the example below:

 1
 2
 3
 4
 5
 6
 7
 8
 9
10
11
12
13
14
15
16
// Define the metrics to be used
let metrics = [];
let metric = cf.Metric('REVENUE', 'avg');

metrics.push(metric);

let color = cf.Color().theme('dark');

let myChart = cf.provider('Elasticsearch')
                .source('books_revenues')
                .rows('GENRE', 'SUBGENRE', 'TOPIC')
                .metrics(...metrics)
                .graph('Sunburst')
                .set('legend', 'right')
                .set('color', color)
                .element('chart');

Note

The default result limit is 10,000. You can change this value by using the .limit(x) function where x is the new limit.

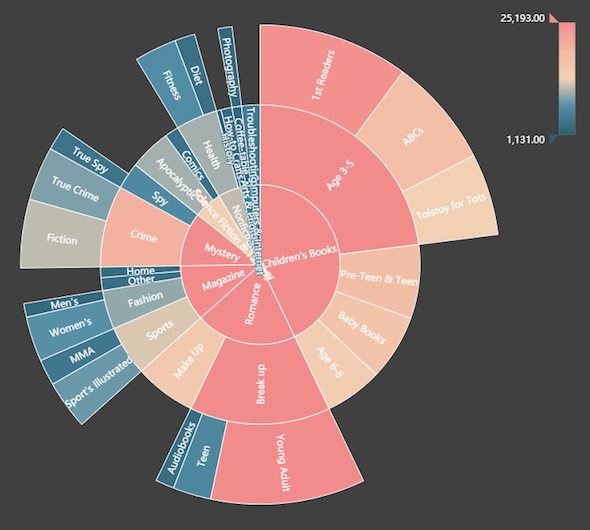
The previous code will render the Sunburst Chart below:
SB M