Axis
Axis options allow a more detailed configuration over the visualization axis. They can be defined as shown below:
1 2 3 4 5 6 | |
Options
The supported options are the following:
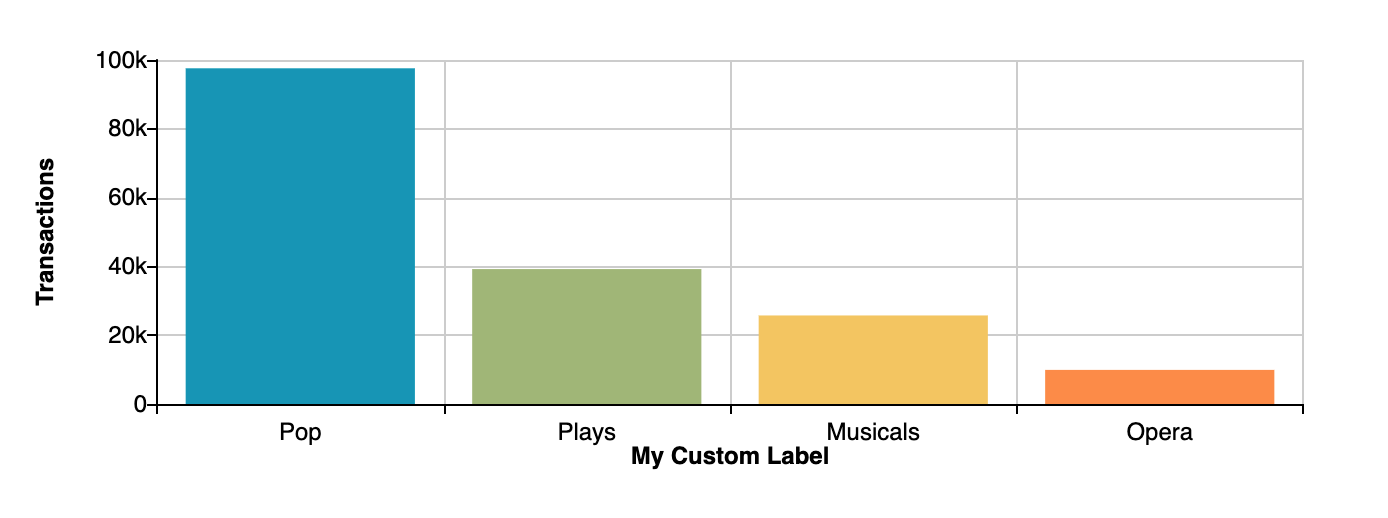
label
Sets a custom label for the specified axis
1 | |
labelGap
Sets the distance between axis name and axis line
1 2 | |
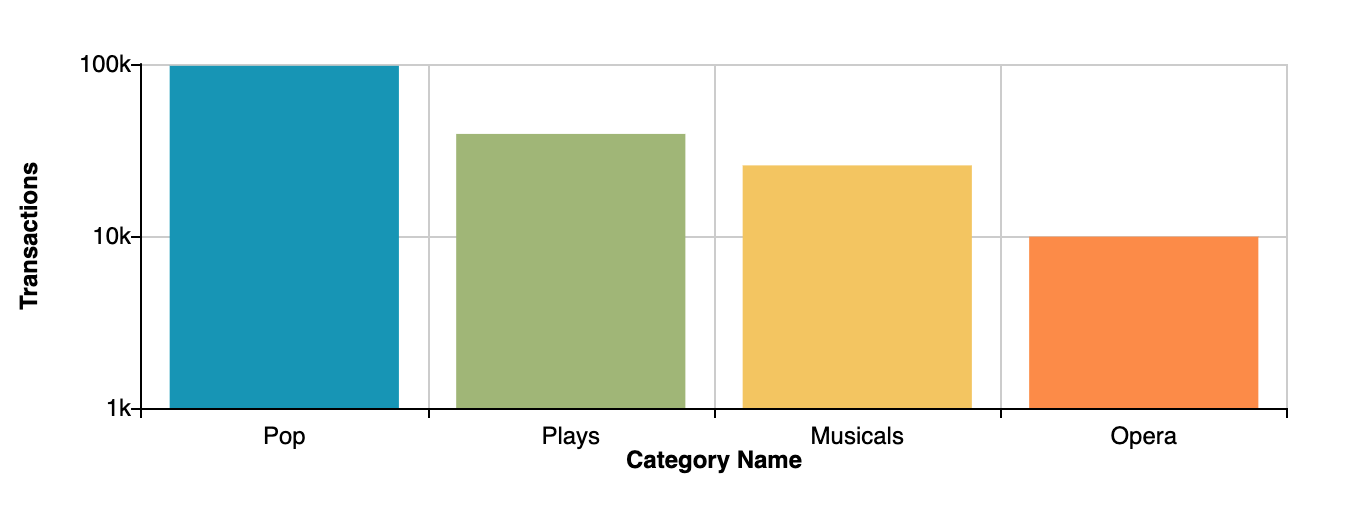
type
Sets what type of values are going to be used. Accepts 'log' or 'values' which is the default.
1 | |
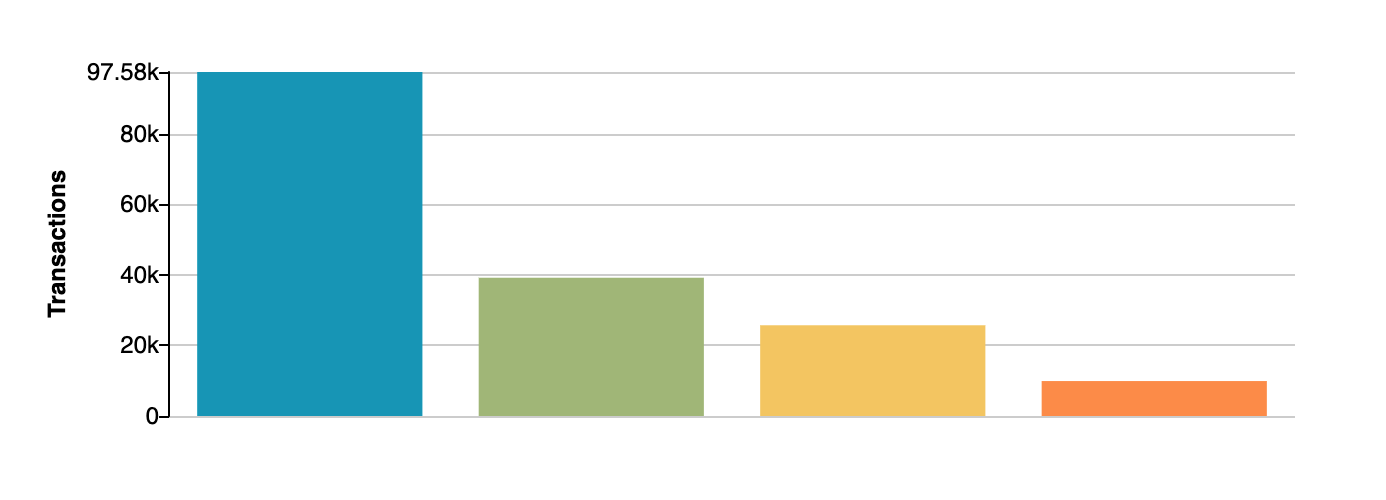
show
Hides or show the specified axis
1 | |
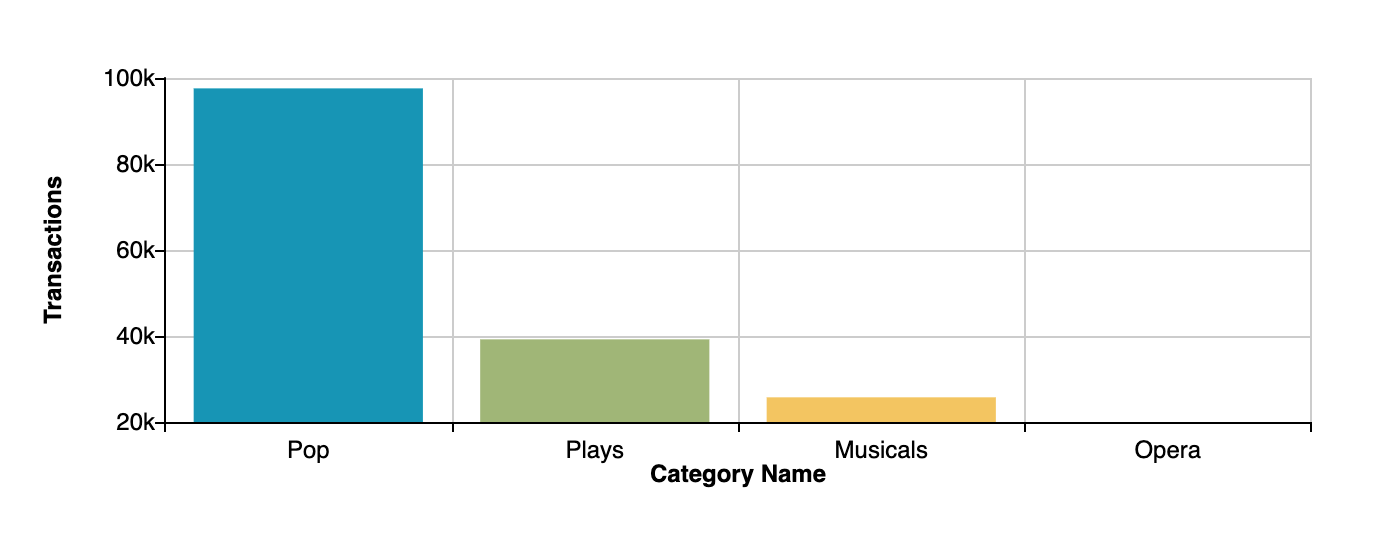
min / max
Sets min and/or max values for the specified axis
1 | |
lines
Hides or displays the grid lines for the specified axis
1 2 | |
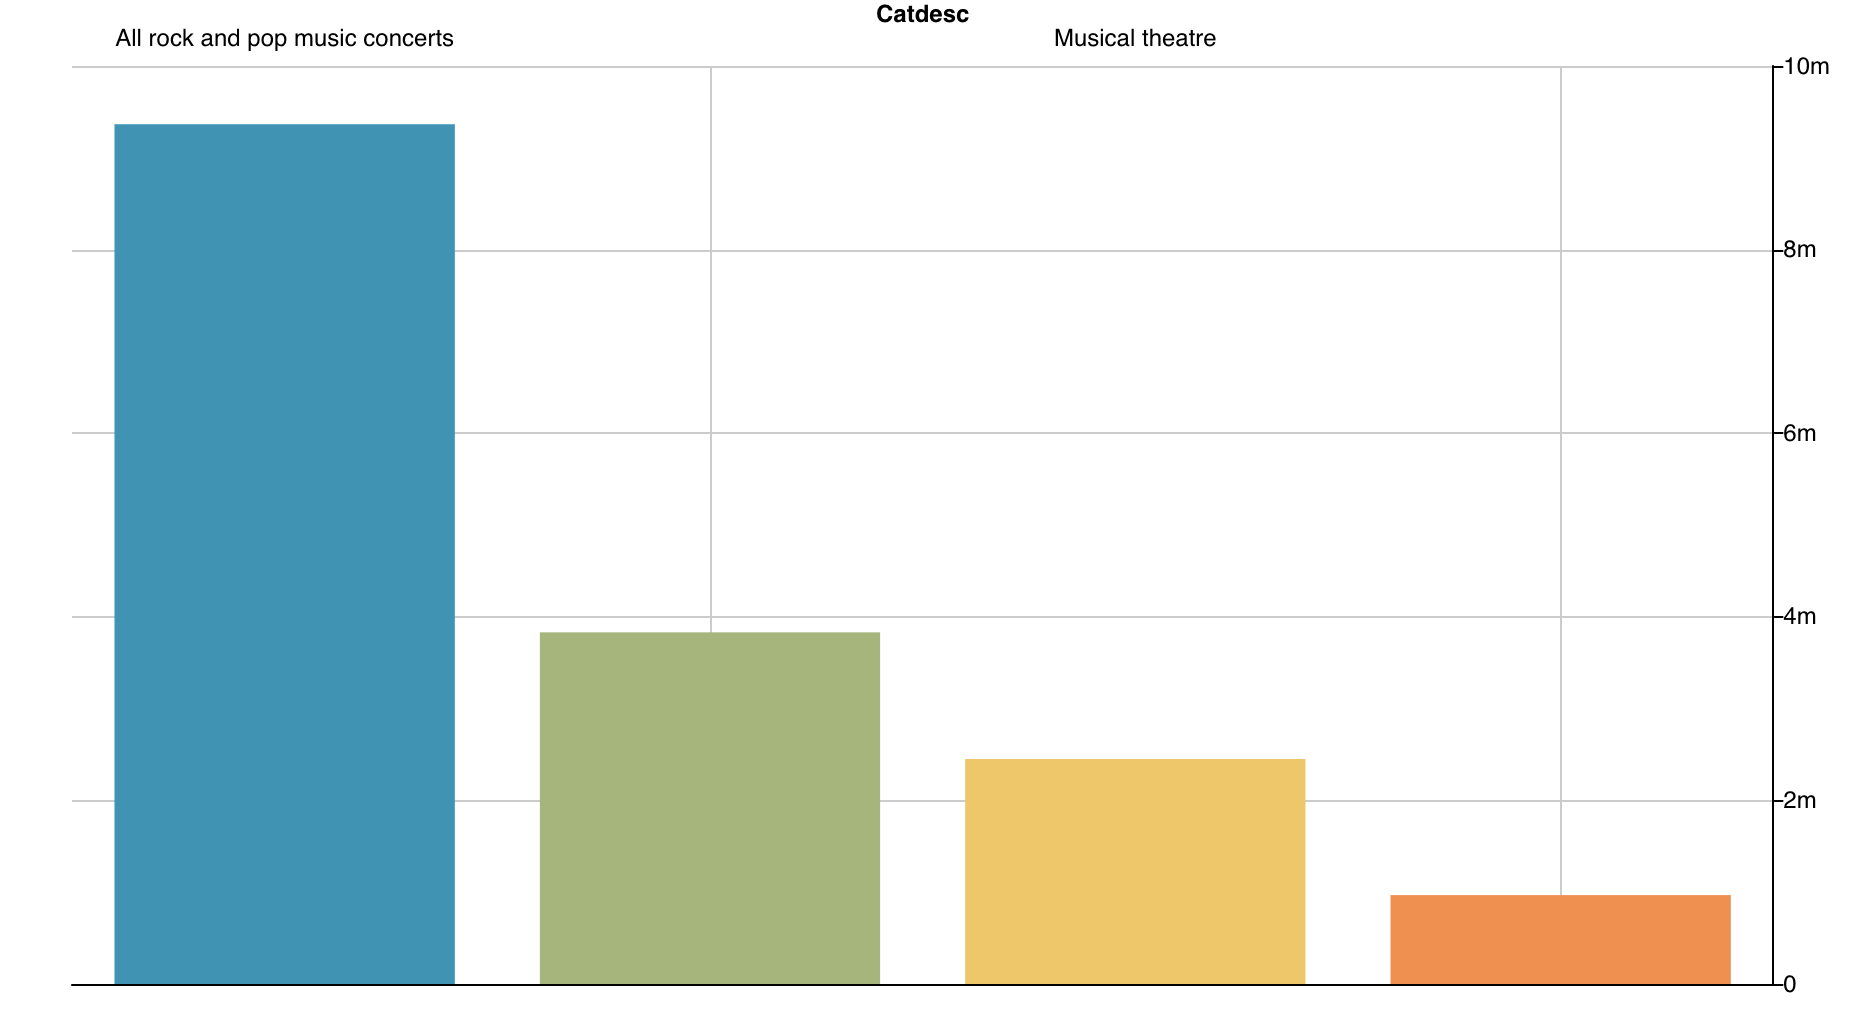
position
Allows to change the axis position. Available values for x-axis are top and bottom, the default value is bottom. Available values for y-axis are left and right, the default value is left.
1 2 | |
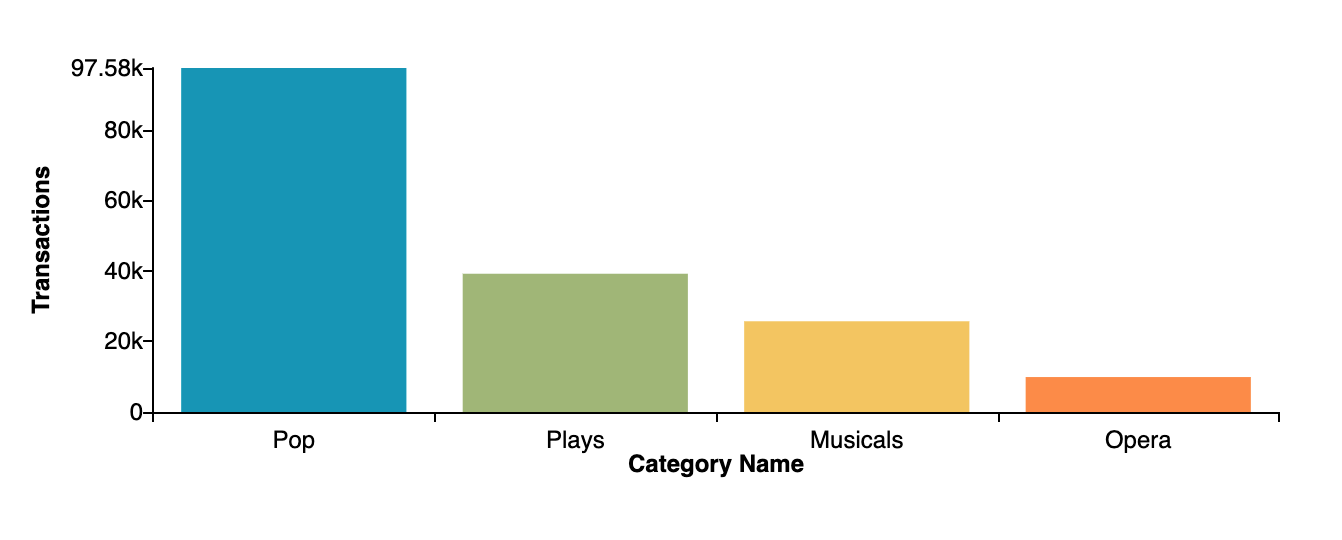
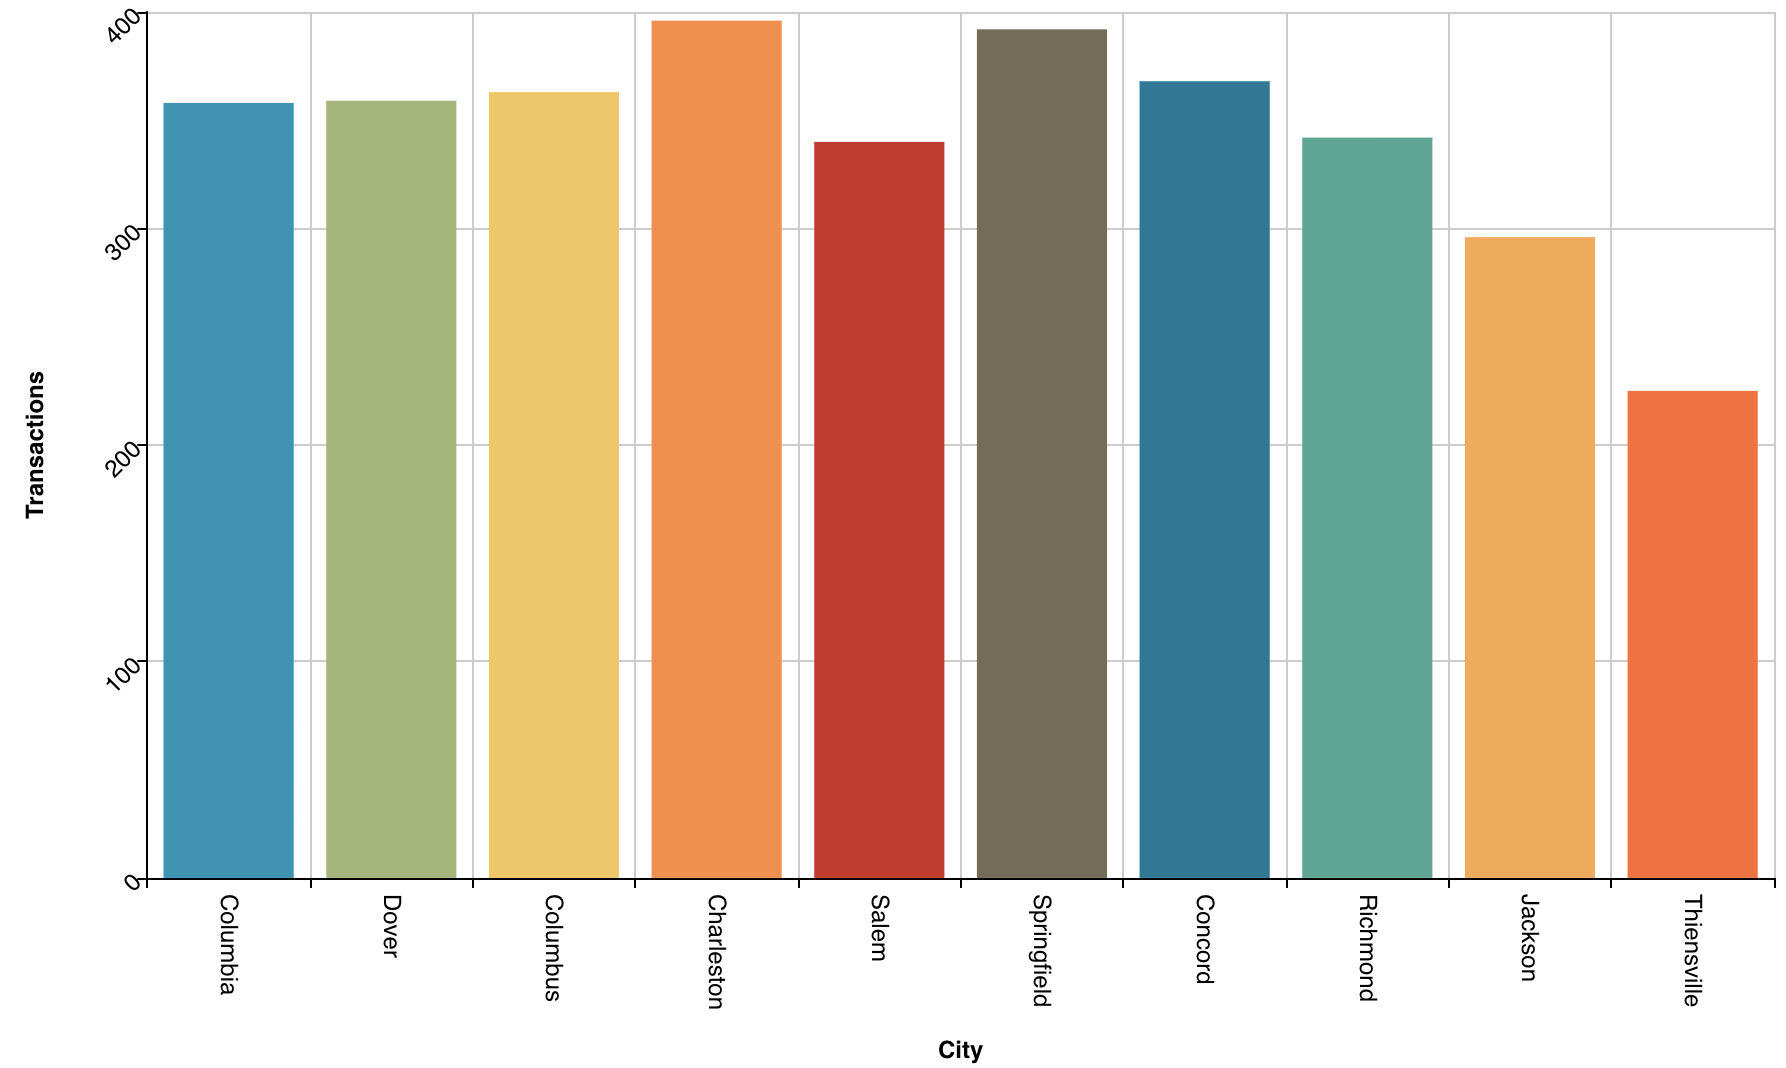
rotate
Allows changing the axis tick label rotation degree, which is especially useful when there is no enough space for the category axis. The supported values are -90 to 90.
1 2 | |
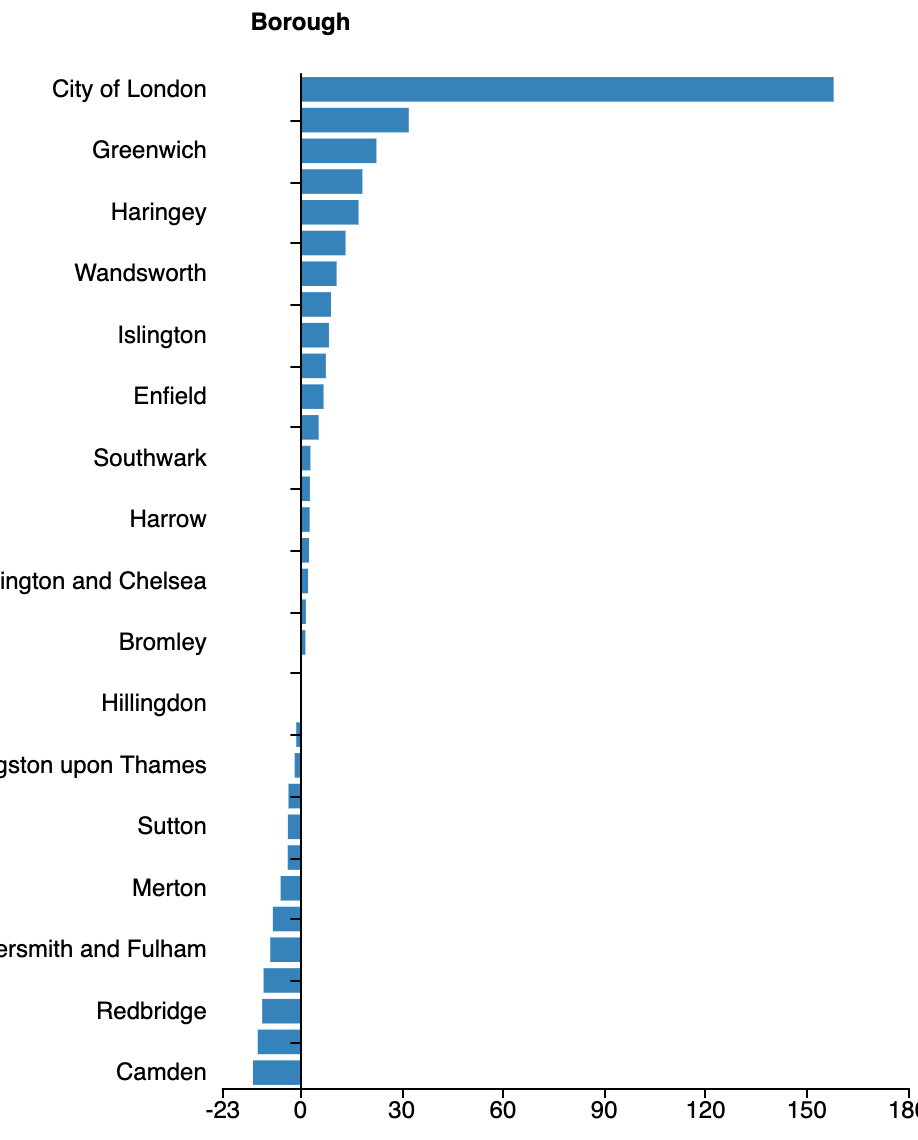
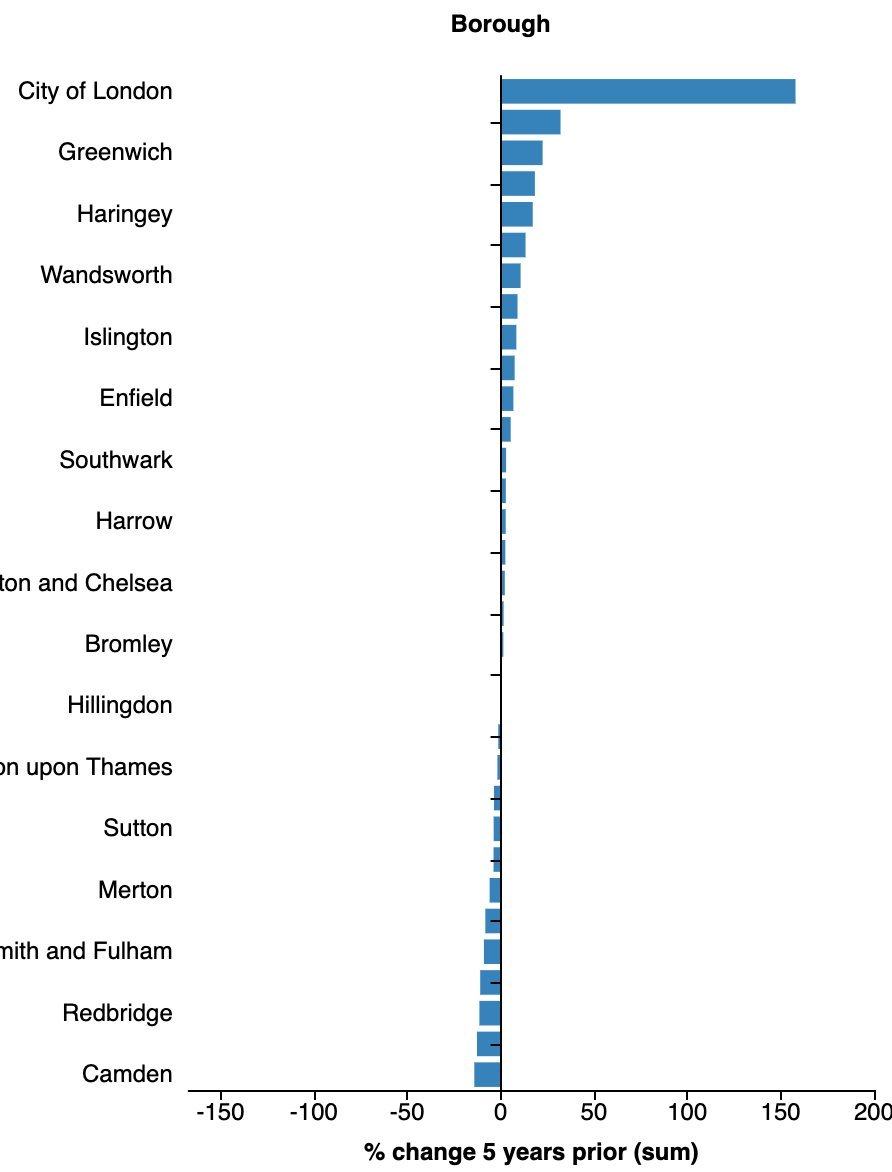
center
Allows to center the bars when we have negative values in the axis. By default the axis is not centered.
1 | |
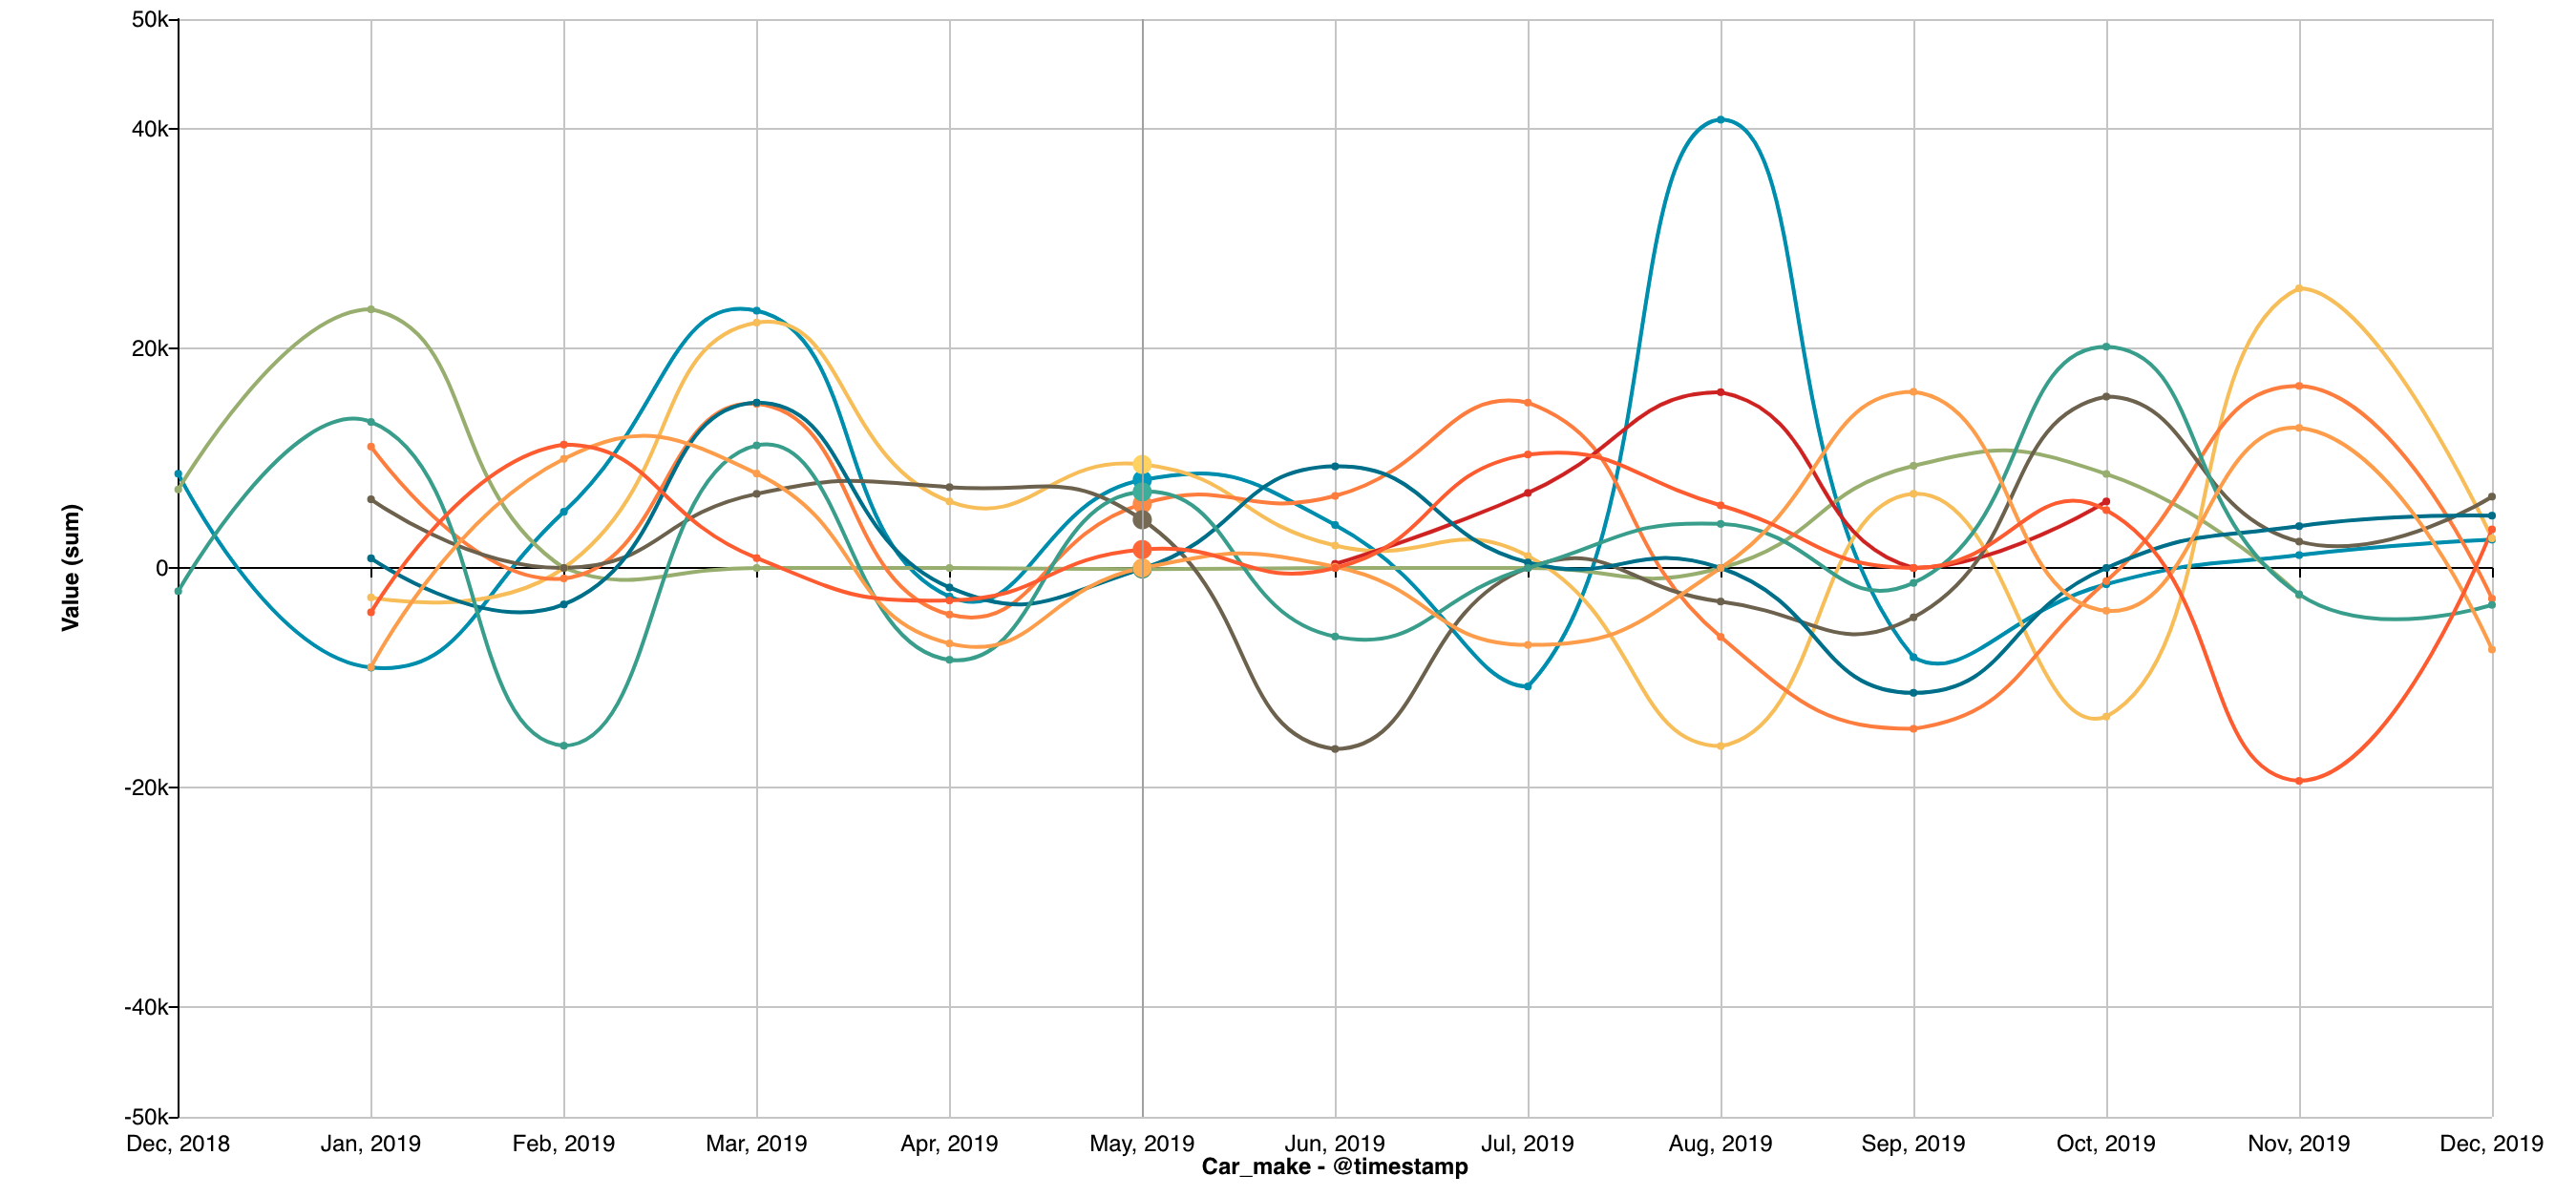
Note
This property is only supported for the Bar chart. To center the axis on other charts (e.g. Trend), set the min/max to the same negative and positive values respectively. Example: .set("yAxis", {min: -50000, max: 50000})
Echarts custom options
For more flexibility, axis options support Echart xAxis and yAxis custom properties to be passed directly.
The following is an example of how to configure an axis with some of those properties:
1 2 3 4 5 6 7 8 9 10 11 12 13 14 15 16 17 18 19 20 21 22 23 24 25 26 27 28 29 30 31 32 33 34 35 36 37 38 39 40 41 | |
The previous configuration used in a Bar chart, will be rendered like this:
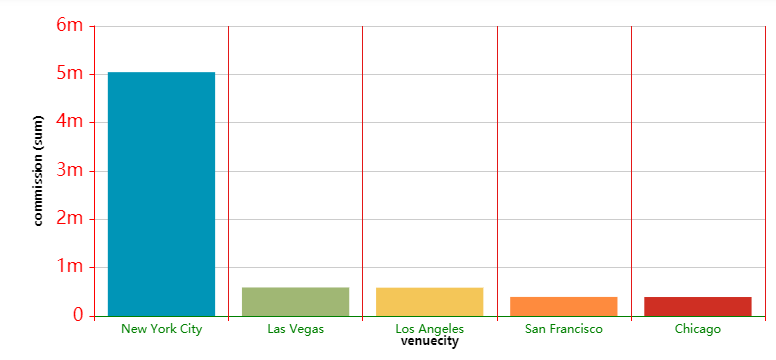
Chart support
| Chart | label | log type | show | min / max | lines | position | rotate | center |
|---|---|---|---|---|---|---|---|---|
| Area Line | Yes | Yes | Yes | Yes | Yes | Yes | Yes | No |
| Bars | Yes | Yes | Yes | Yes | Yes | Yes | Yes | Yes |
| Bars and Line | Yes | No | Yes | Yes | Yes | Yes | Yes | No |
| Box Plot | Yes | Yes | Yes | No | Yes | Yes | Yes | No |
| Floating Bubbles | Yes | Yes | Yes | Yes | Yes | Yes | Yes | No |
| Histogram | Yes | Yes | Yes | Yes | Yes | Yes | Yes | No |
| Multigroup Trend | Yes | No | Yes | Yes | Yes | Yes | Yes | No |
| Multimetric Area Line | Yes | No | Yes | Yes | Yes | Yes | Yes | No |
| Multimetric Bars | Yes | No | Yes | Yes | Yes | Yes | Yes | No |
| Multimetric Trend | Yes | No | Yes | Yes | Yes | Yes | Yes | No |
| Scatter Plot | Yes | Yes | Yes | Yes | Yes | Yes | Yes | No |
| Trend | Yes | No | Yes | Yes | Yes | Yes | Yes | No |