Time Range Fitler
The Time Range Filter (TRF) allows users to filter data based on time windows. We can create this component by using a time field and a metric to reflect the data:
1 2 3 4 5 6 7 8 9 10 11 12 13 | |
Then, we'll see the component:
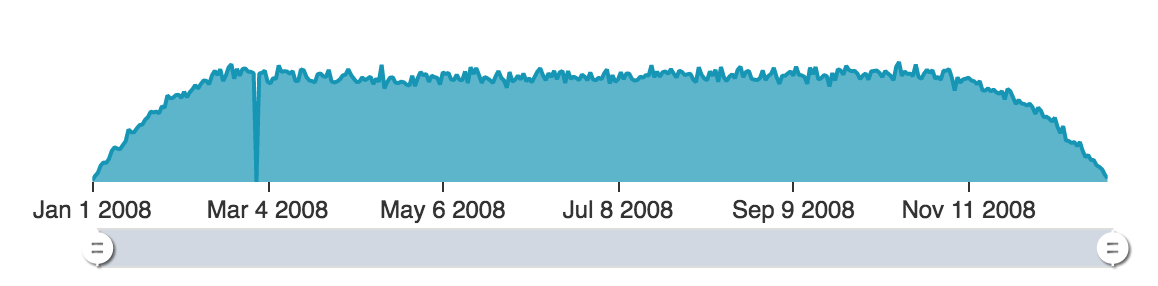
The data plotted in the chart is the combination of the used metric with the time field. The dataZoom component below the visual is what is used to apply filters after we subscribe to its event:
1 2 3 4 5 6 7 8 9 10 11 12 13 14 15 16 | |
What the function applyFilter does is to create a new Filter object with the values provided in data. It then gets all the visualizations and applies the filter to them, except for the TRF. This validation must be done to avoid self-filter that will restrict the data. From here we can exclude the visualizations that we don't want to filter.
Slider data background
The slider handler by default comes with a solid gray color as a background as we can see in the component's picture above. This can be changed to display the same data that is displayed when the component is fully rendered. So if we specify this option:
1 | |
We'll se how the slider shows the data:
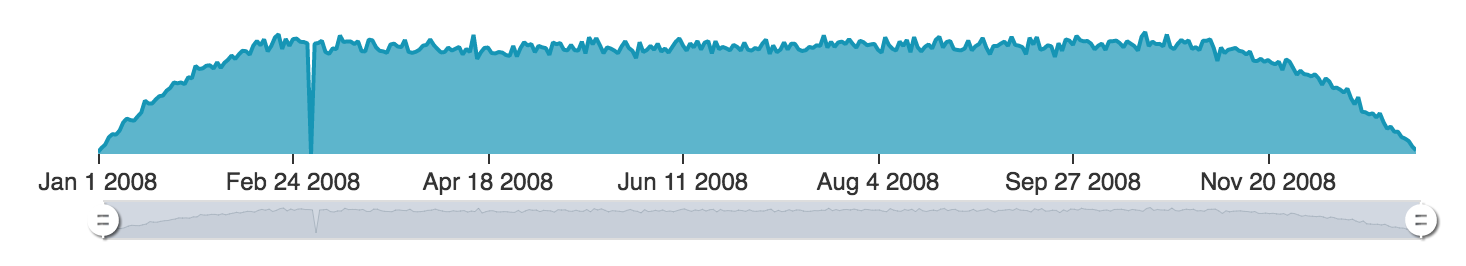
With this option we can see the entire data behavior all the time while we are moving the slider.