Packed Bubbles
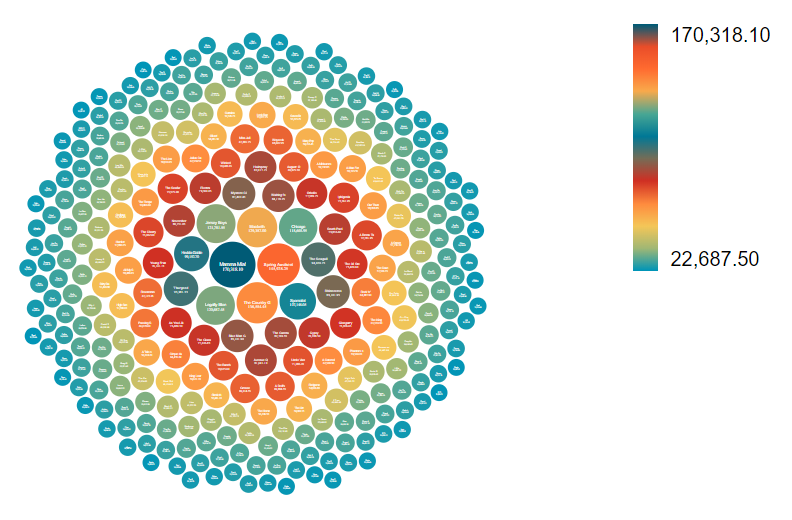
Packed Bubbles is a visualization that allows to show differences of values between a fairly large range of elements with only a quick look. A Packed Bubbles chart can be obtained with the following code:
 1
 2
 3
 4
 5
 6
 7
 8
 9
10
11
12
13
14
15
16
17
18
19
20
21
22
23
24
25
26
27
28
29
30
31
32
33
34
35
36
37
38 | // Define the metrics to be used
let metrics = [];
let metric = cf.Metric('commission', 'sum');
const countMetric = cf.Metric('count');
// define attribute to group by
let groups = [];
let group = cf.Attribute('eventname')
.limit(300)
.sort('desc', metric);
metrics.push(metric);
metrics.push(countMetric);
groups.push(group);
let color = cf.Color();
let palette = [
'#fdd49e',
'#fdbb84',
'#fc8d59',
'#ef6548',
'#d7301f',
'#b30000',
'#7f0000'
];
color.palette(palette);
color.metric(metric);
let myChart = cf.provider('Elasticsearch')
.source('ticket_sales')
.groupby(...groups)
.metrics(...metrics)
.graph('Packed Bubbles')
.set('legend', 'right')
.set('color', color)
.element('chart')
.execute();
|
Previous code will render a Packed Bubbles like follow:
Important
The Packed Bubbles chart uses d3.js which is loaded from a third-party server. You can override this location by declaring a global variable of name "d3Url". The value of the variable should be a string with the path from where the library should be loaded.