React Demo
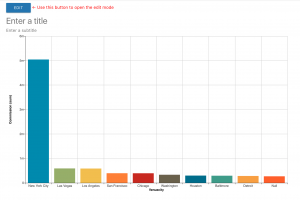
This demo illustrates how to use ChartFactor within a React application. Use this link to open the demo and explore Ticket Sales data using different visualizations and configurations. You should see a page like this:
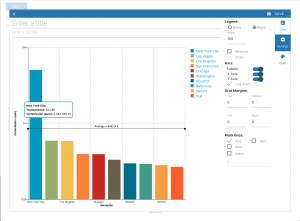
After opening the demo, use the “Edit” button to update different configuration options, including title and subtitle of the chart. You should see a page like this:
This application renders data from a Ticket Sales table residing in our Elasticsearch server. The Ticket Sales table is derived from the Amazon’s Sample Database for Redshift. The data represents ticket sales activity for the fictional TICKIT web site, where users buy and sell tickets online for different types of events.
Please contact the Aktiun team to review this source code.