Mark Lines
Mark lines are displayed to highlight four specific values within the visualization. These values are max, min, average, and value where this last one represents a custom value on the data we want to use. MarkLines apply to almost all gridded visualizations like Bars, Bars and Line, Line Trend, Scatter, etc. Not gridded visuals are Pie, Donut, Radar, Disk, etc. To display these lines we'll use the MarkLine object from ChartFactor
1 2 3 4 5 6 7 8 | |
Please note the use of markline in singular.
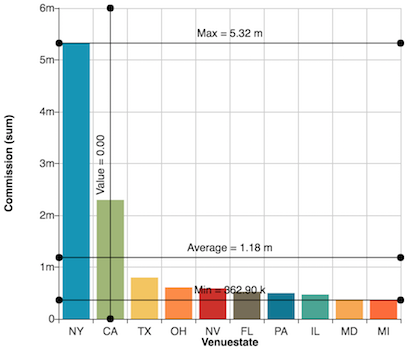
This will make the chart look like this:
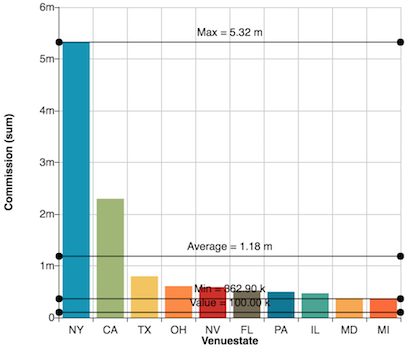
We see here the 4 lines we just set to be displayed in the visualization. Except for the Value, the rest are automatically calculated. Value is used as we mentioned earlier to highlight a specific value in our data. In this case we decided to see where 100k starts. For this we used the yAxis. We could do the same using xAxis and then highlight one of the bars:
1 2 3 4 5 | |
Then we'll see the item for California selected. This is specially useful when we have a large number of bars: