Trend
Trend or Trend Attribute is a two-group visualization that allows to see the behaviour of a given field over time for a given metric. Other types of trend visualizations are supported: refer to Multimetric Trend to trend multiple metrics and to Multigroup Trend to trend the combination of multiple attribute values over time.
Creating a Trend
The Trend visualization requires at least one metric and two fields. The first one is a time field, the second one is an attribute field
1 2 3 4 5 6 7 8 9 10 11 12 13 14 15 16 17 18 19 | |
The previous code will render the Trend Chart below:
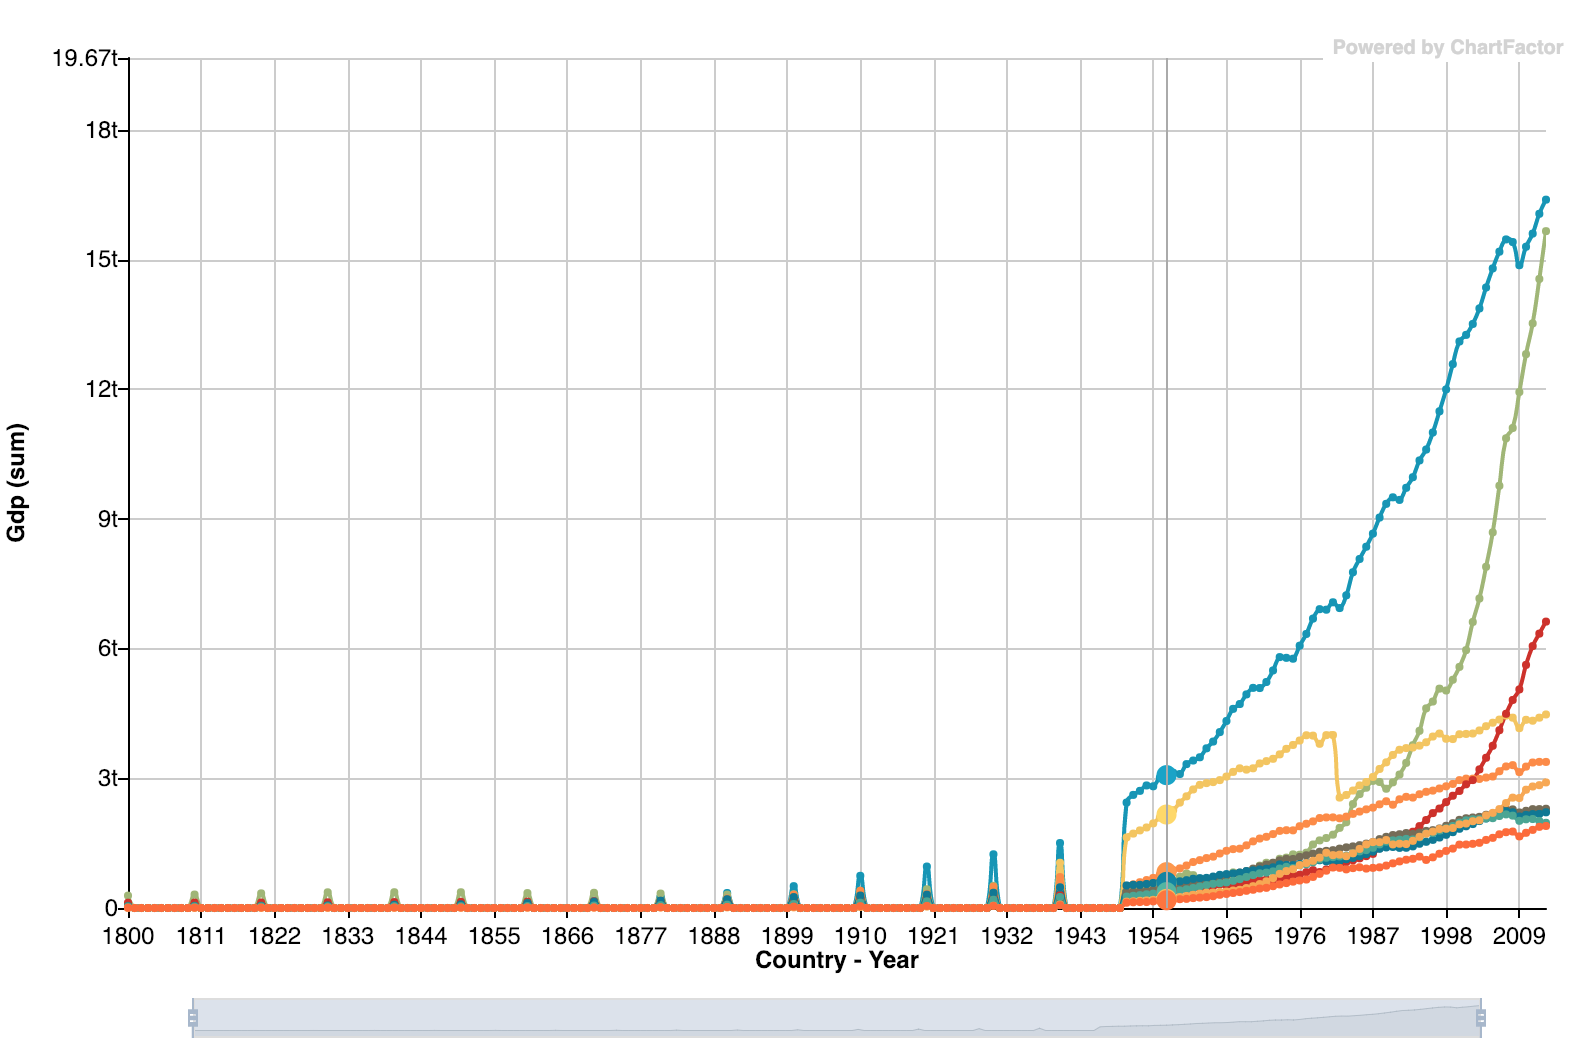
Symbol size
Also you can change the size of the circle symbol using the symbolSize option as follow:
1 | |
Special filtering behaviour
The Trend visualization has some specificities when it comes to filters. Since it uses two groups, the first group (the attribute) will always be recognized as a filter, but the second one (the time field) will be recognized as a client filter ONLY IF it represents a single time unit, for example a year, a month, a day... etc AND it was not previously applied as a non-client filter, otherwise it will act as a normal filter.
The best way to check this is by clicking a point of any of the lines. It will apply a filter like the following:
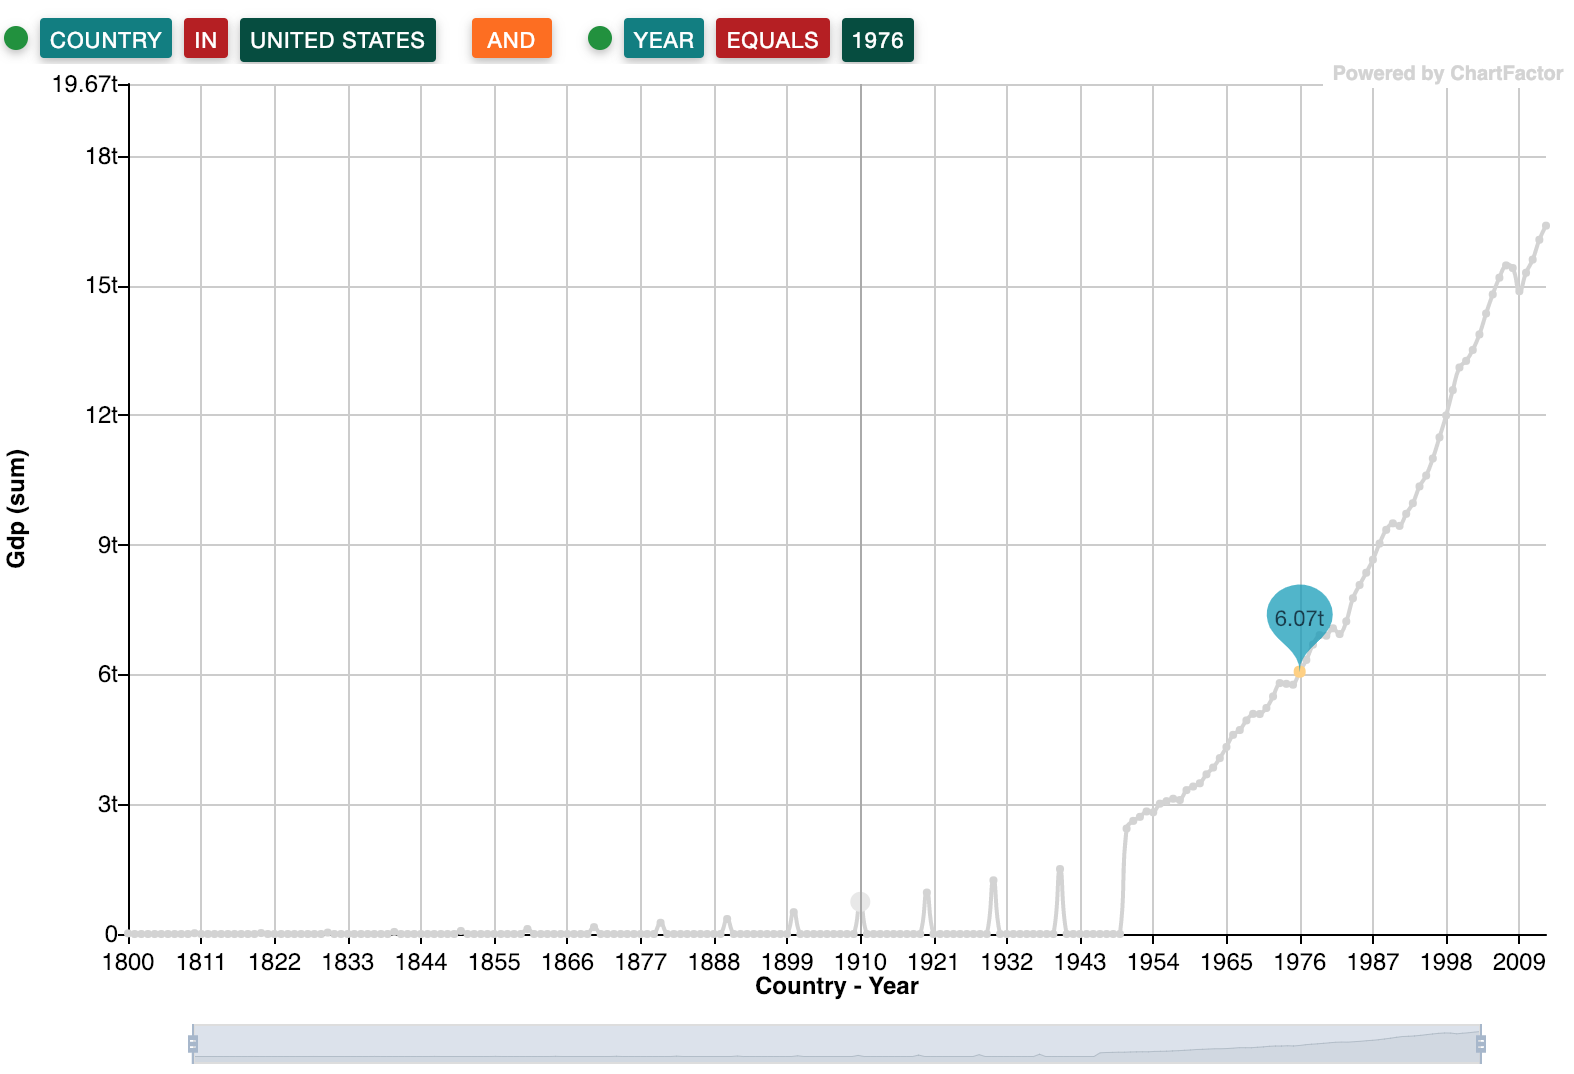
As we can see in the picture above, all lines except for the one representing United Stated where removed (filtered) however the full line of time is still there providing, in this way, a better visualization event though the is (client) filtered by the year 1976.
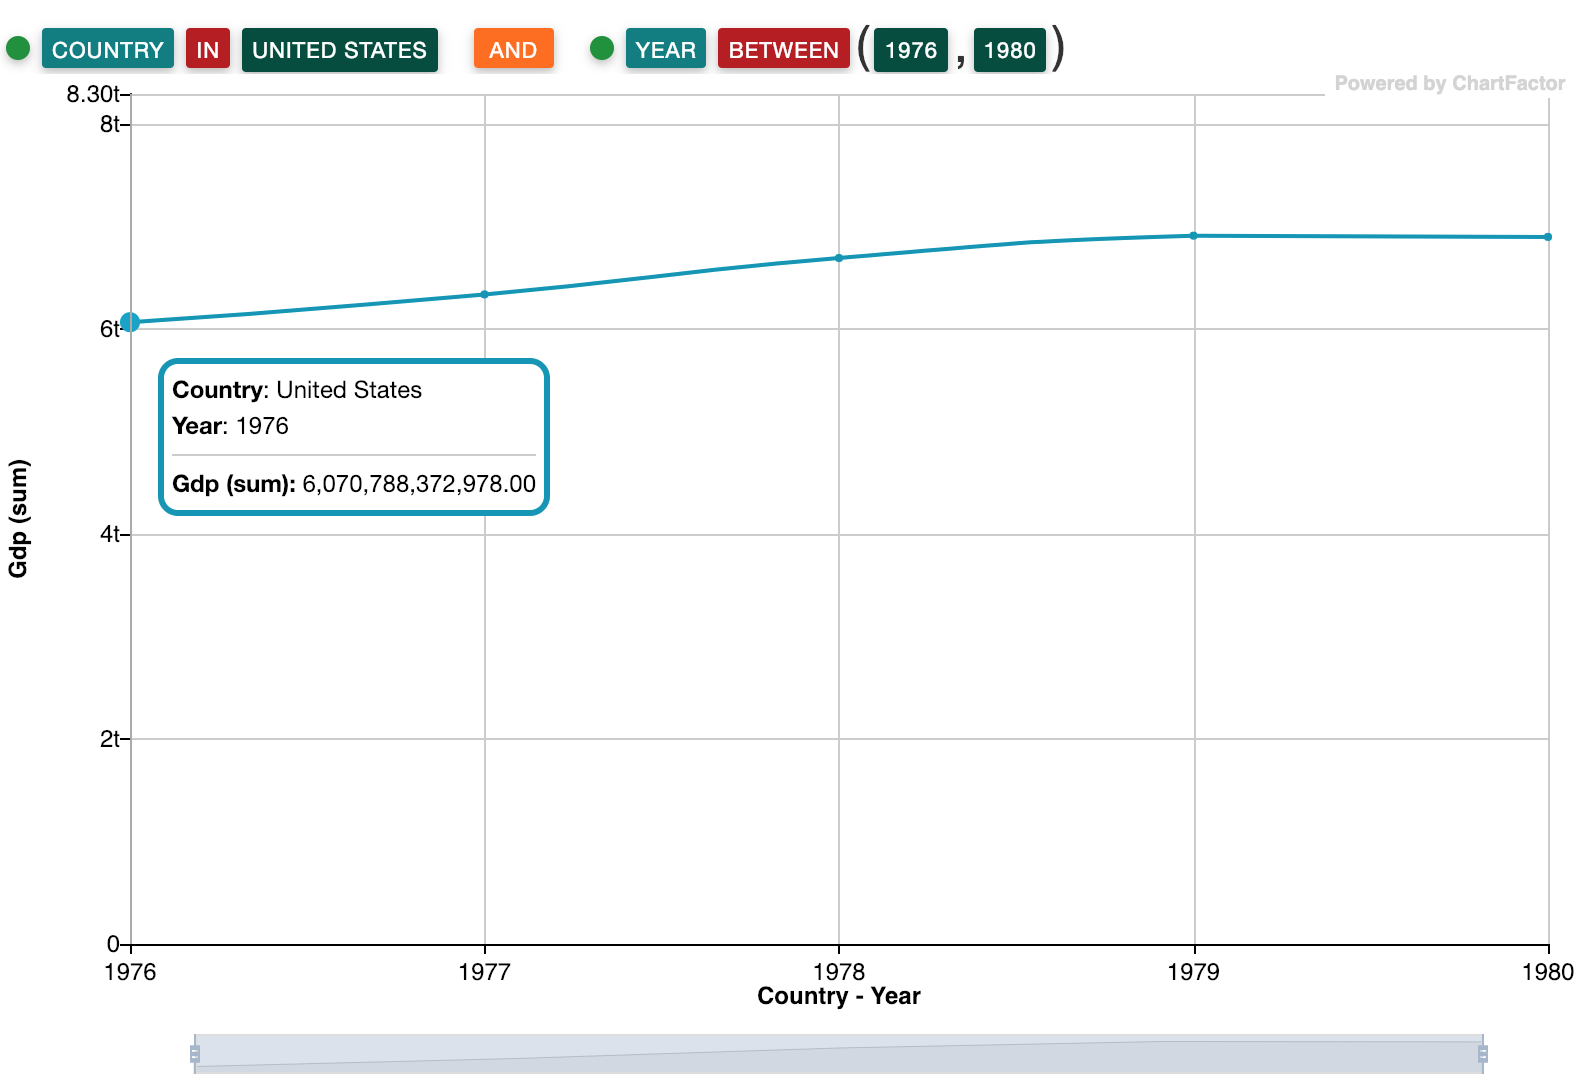
If we then expand the range, it won't be a single year anymore and the filter representing the time will start behaving as a normal filter:
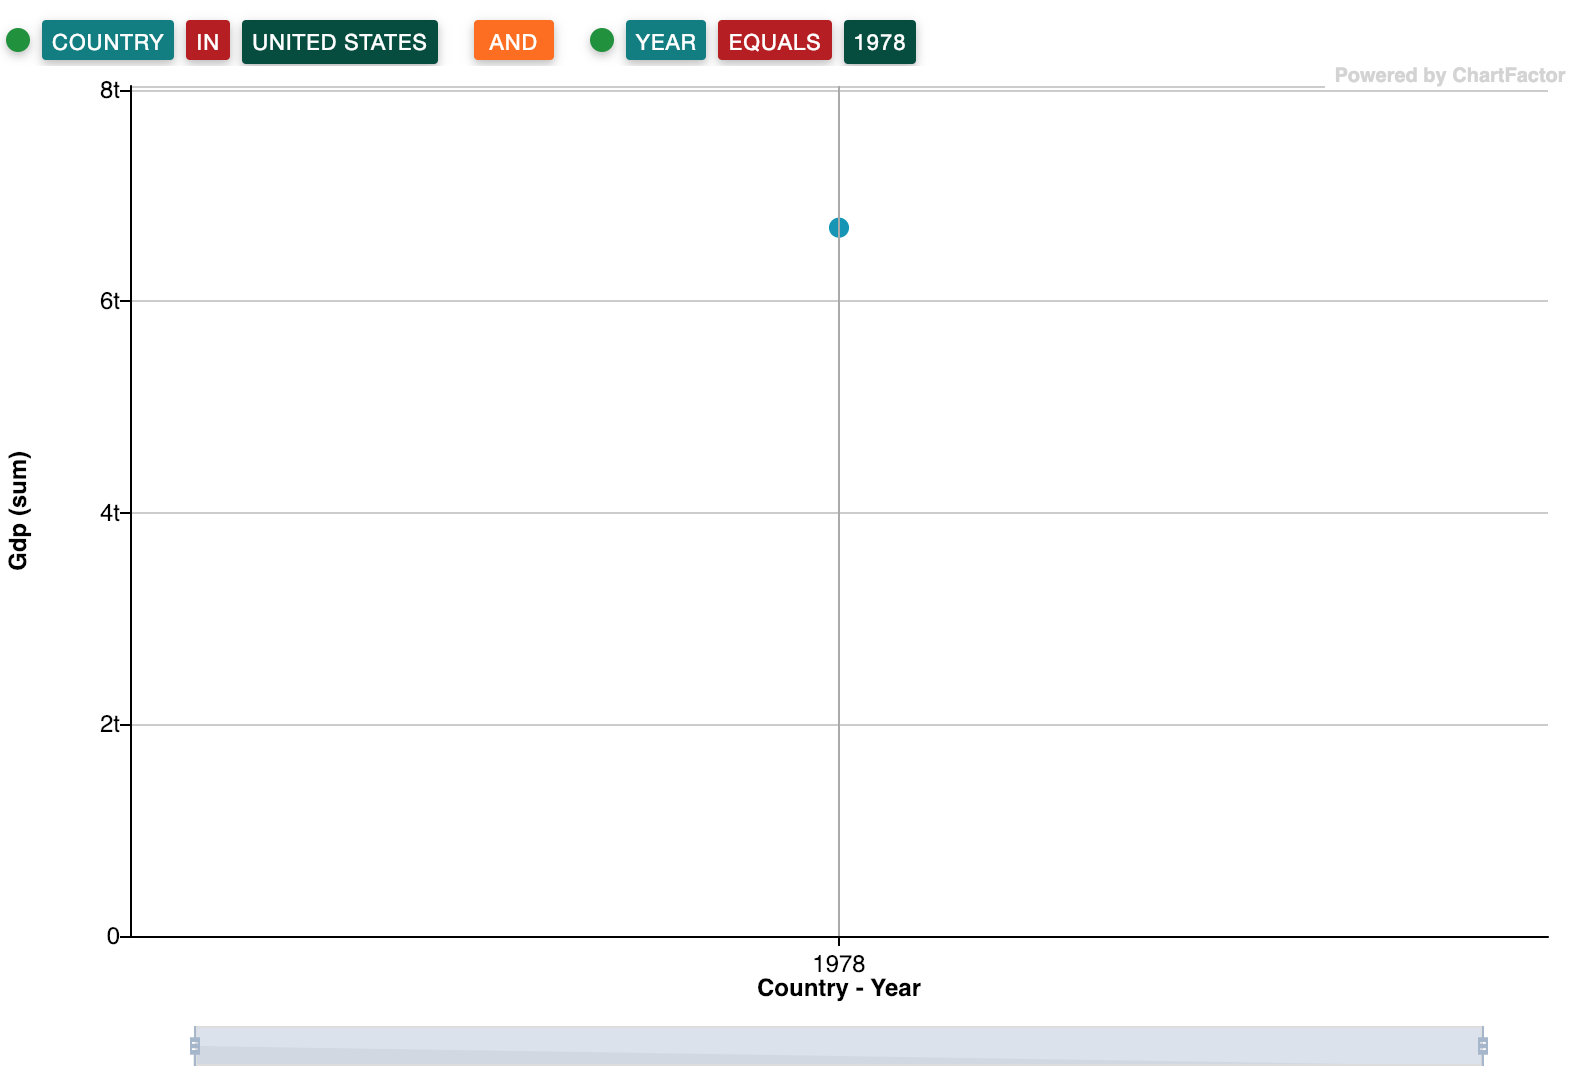
However if we select again one point or apply a time filter representing on unit, it will be respected as a normal filter instead of being applied as a client filter:
Note
This filtering behavior also applies to the Area Line visualization.