Grid
Sometimes when embedding a visualization in an HTML element, if it is not well styled, the chart may have display issues such as missing or oversized spaces, or values clipped by a DIV container element for example. One way to solve these issues is to apply CSS styles. Another way is to use the Grid object to handle the margins of the visualization.
1 2 | |
The code above defines a 200px left marging and a 300px top margin. This code will make the chart look like the picture below.
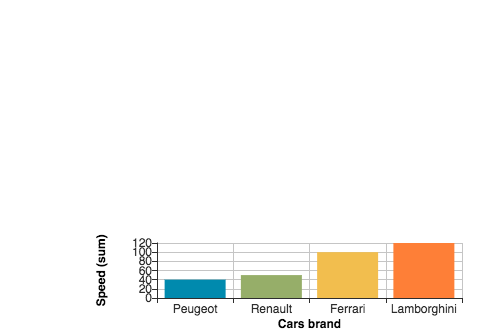
Notice how the extra left and top margins shrink the visual. This of course is a little bit exaggerated, but it shows the point on how the Grid object affects the visual. It also supports .right() and .bottom()