Pie
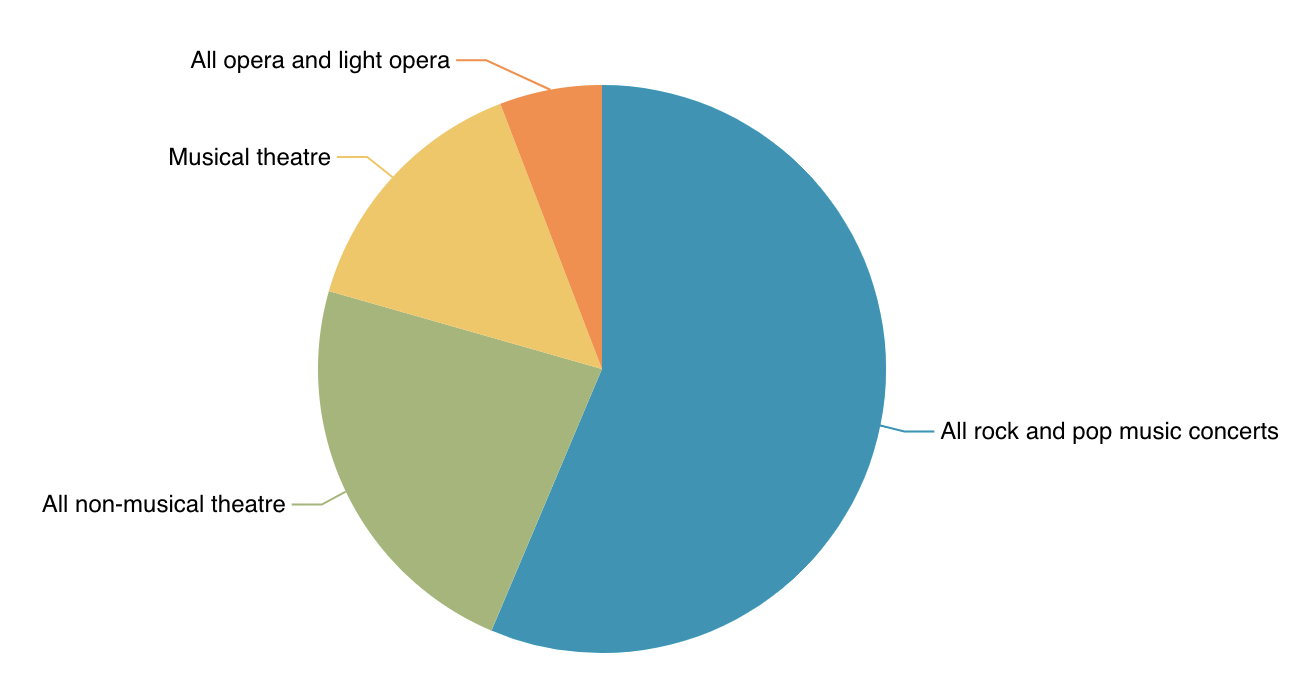
The Pie chart is suitable for illustrating the numerical proportion between different categories. The ChartFactor toolkit allows to define a Pie chart in the following way:
 1
 2
 3
 4
 5
 6
 7
 8
 9
10
11
12 | // Define the metrics to be used
let metric0 = cf.Metric('commission', 'sum');
let group0 = cf.Attribute("catdesc.keyword")
.limit(10)
.sort("desc", cf.Metric("commission", "sum"));
let myChart = cf.provider('Elasticsearch')
.source('ticket_sales')
.groupby(group09)
.metrics(metric0)
.graph('Pie')
.element('chart');
|
The previous code will render the Pie Chart below:
Pie configuration
The Pie chart supports multiple options to change its rendering behavior. The following are the supported settings:
-
labelPosition: This option defines the position of the labels. Posible values are: inside and outside. The default is outside.
-
metricValue: This option allows users to render metric values as labels instead of categories. Valid values are true and false. The default value is false.
Font color
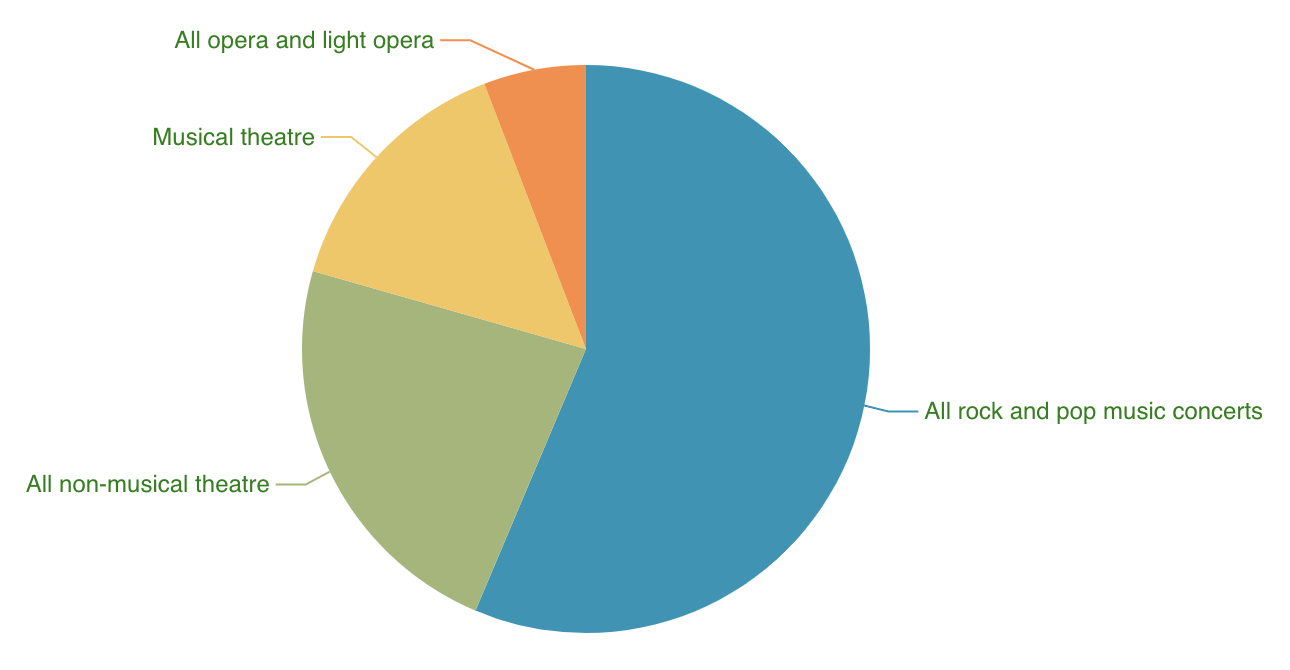
If you need to change the label's font color, you can use the cf.Color().theme({ font: 'green' }) object. The user can set any color using the theme fuction and setting the font key inside. The following code changes the font to a green color:
 1
 2
 3
 4
 5
 6
 7
 8
 9
10
11
12
13
14 | // Define the metrics to be used
let metric0 = cf.Metric('commission', 'sum');
let group0 = cf.Attribute("catdesc.keyword")
.limit(10)
.sort("desc", cf.Metric("commission", "sum"));
let color = cf.Color().theme({ font: 'green'})
let myChart = cf.provider('Elasticsearch')
.source('ticket_sales')
.groupby(group09)
.metrics(metric0)
.graph('Pie')
.set("color", color)
.element('chart');
|
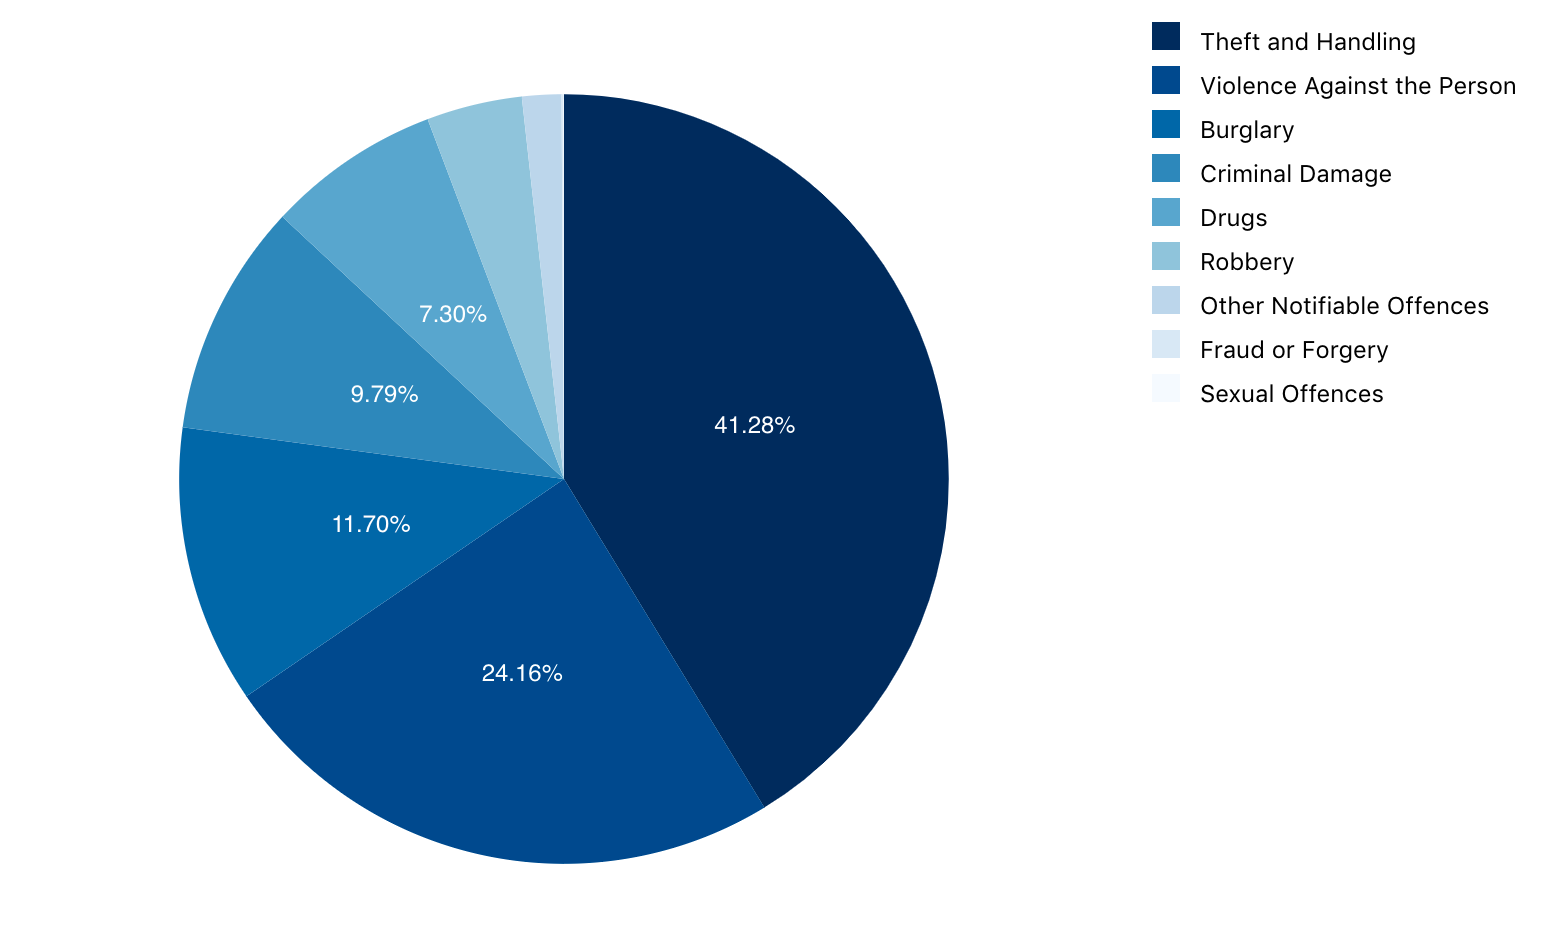
If you set labelPosition to inside, the Pie chart will render the labels with a font color according to the background color of the shape to make sure labels are readable. This behavior takes prescedence over a font color specified in a theme object, which only applies when labels are rendered outside the slices. The following code change the font to a green color:
 1
 2
 3
 4
 5
 6
 7
 8
 9
10
11
12
13
14
15
16
17
18
19
20
21
22
23
24
25
26
27
28
29
30 | // Define the metrics to be used
let metric0 = cf.Metric("value", "sum");
let percent = cf.CompareMetric("value", "sum")
.rate()
.label('Percent');
// Define attributes to group by
let group1 = cf.Attribute("major_category")
.limit(10)
.sort("desc", cf.Metric("value", "sum"));
// Add metrics and groups to data source
let myData = source.groupby(group1)
.metrics(percent, metric0);
// Define Legend
let legend = cf.Legend()
.position("right")
.width(150)
.sort("none");
// Define Color Palette
let color = cf.Color()
.palette(["#08306b", "#08519c", "#2171b5",
"#4292c6", "#6baed6", "#9ecae1",
"#c6dbef", "#deebf7", "#f7fbff"]);
// Execute chart
let myChart = myData.graph("Pie")
.set("legend", legend)
.set("color", color)
.set("labelPosition", "inside")
.set("metricValue", true)
.execute();
|