Viewing the chart data
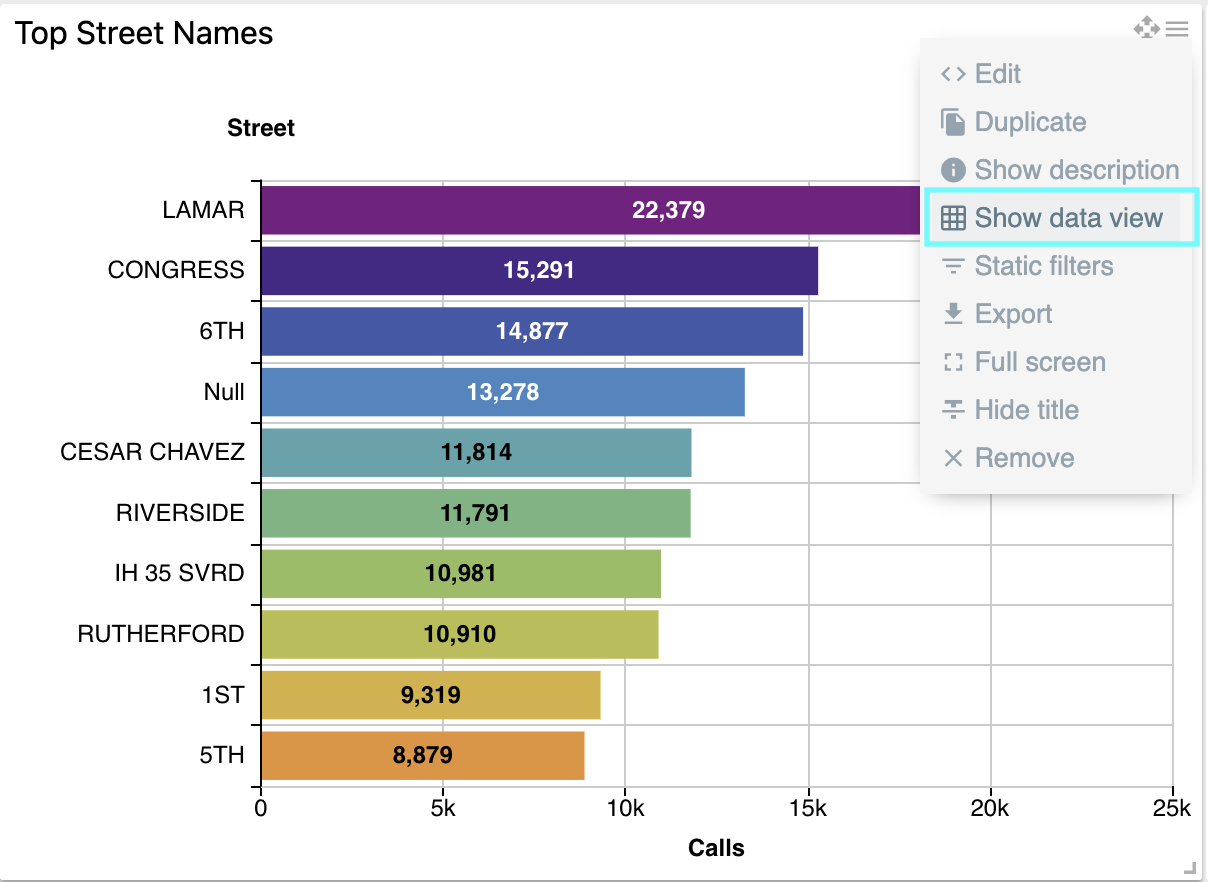
Sometimes, it is useful to see the actual data powering your data visualization. To view the data behind a visualization in ChartFactur Studio, use the Show data view option located on the top right corner menu of the widget. See below:
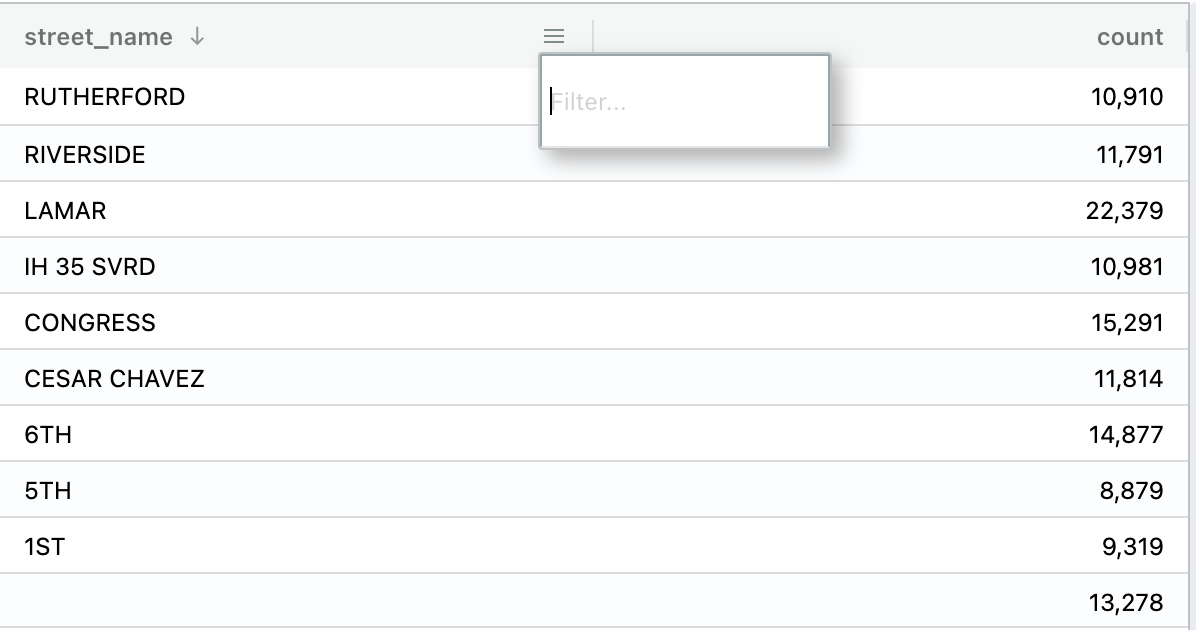
After selecting this option you should see a table with the data of the respective visualization. You can sort and filter columns values. See the picture below:
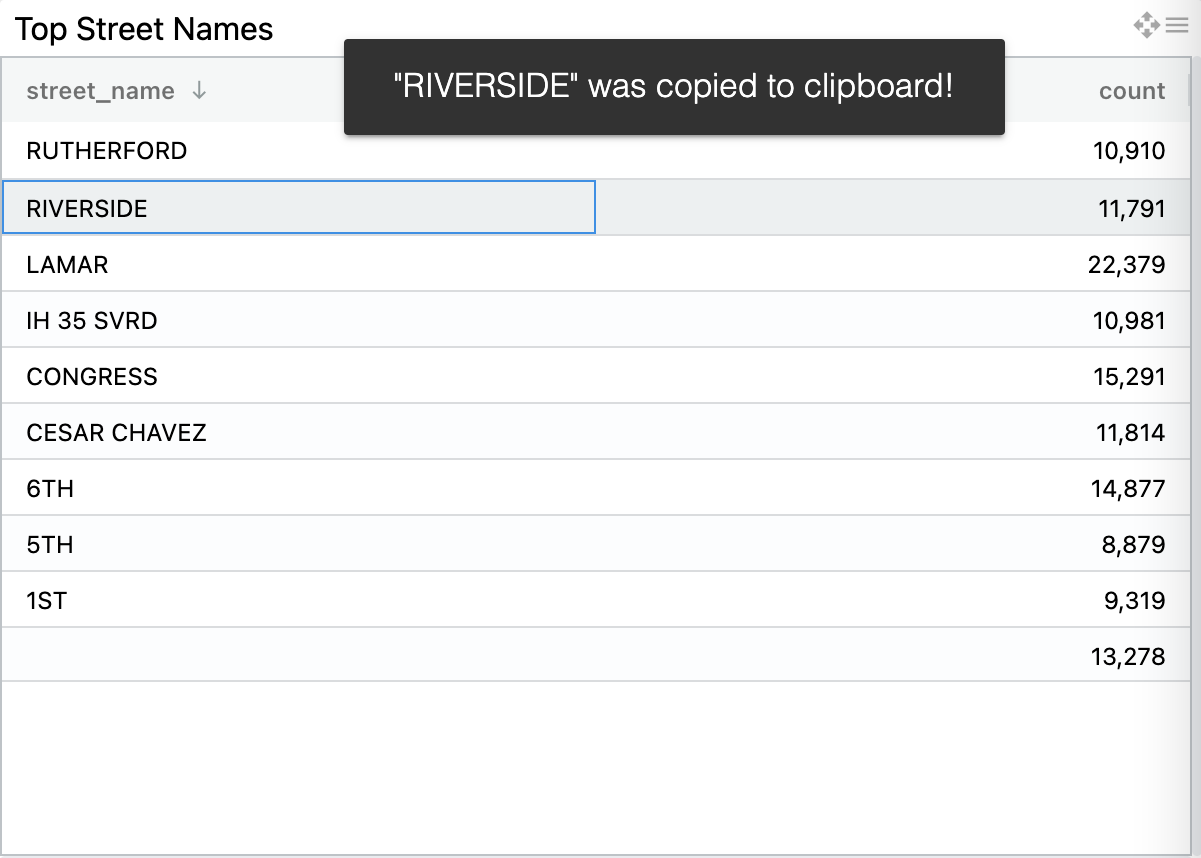
Also you can copy a value from the table just clicking on a cell:
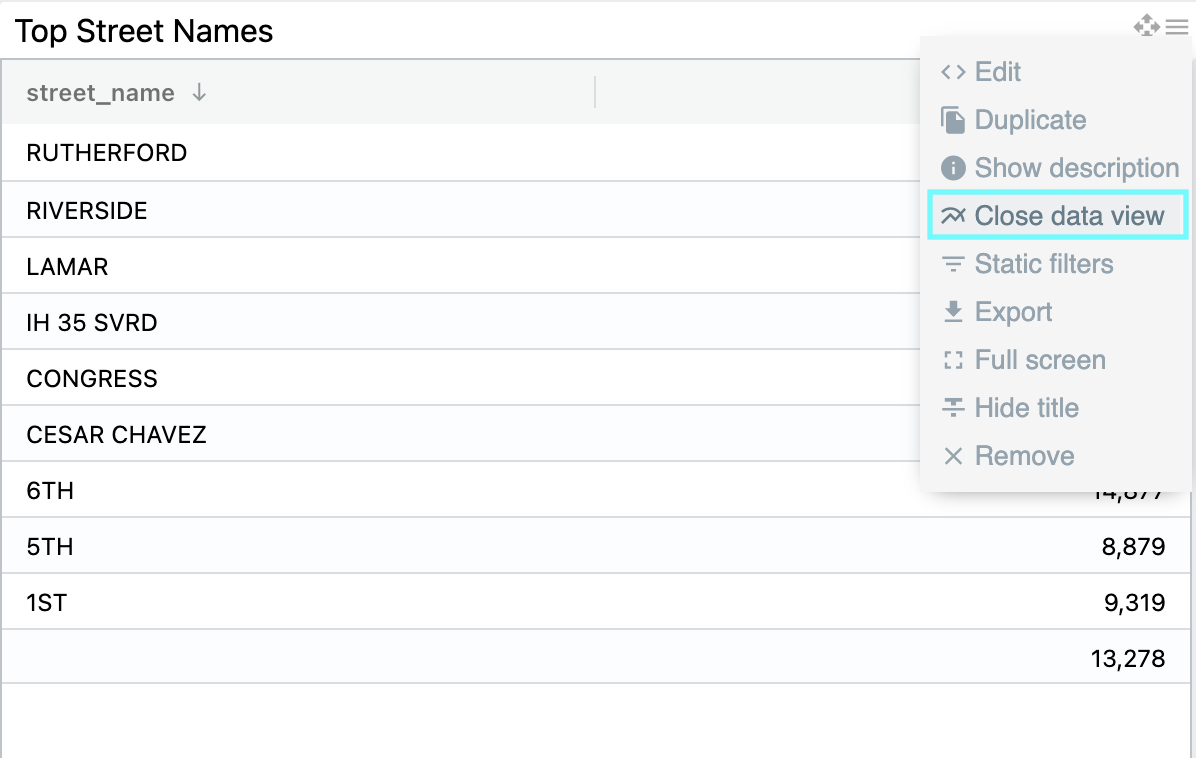
Use the Close data view option on the widget menu to go back to visualization mode.