Configuring drill hierarchies
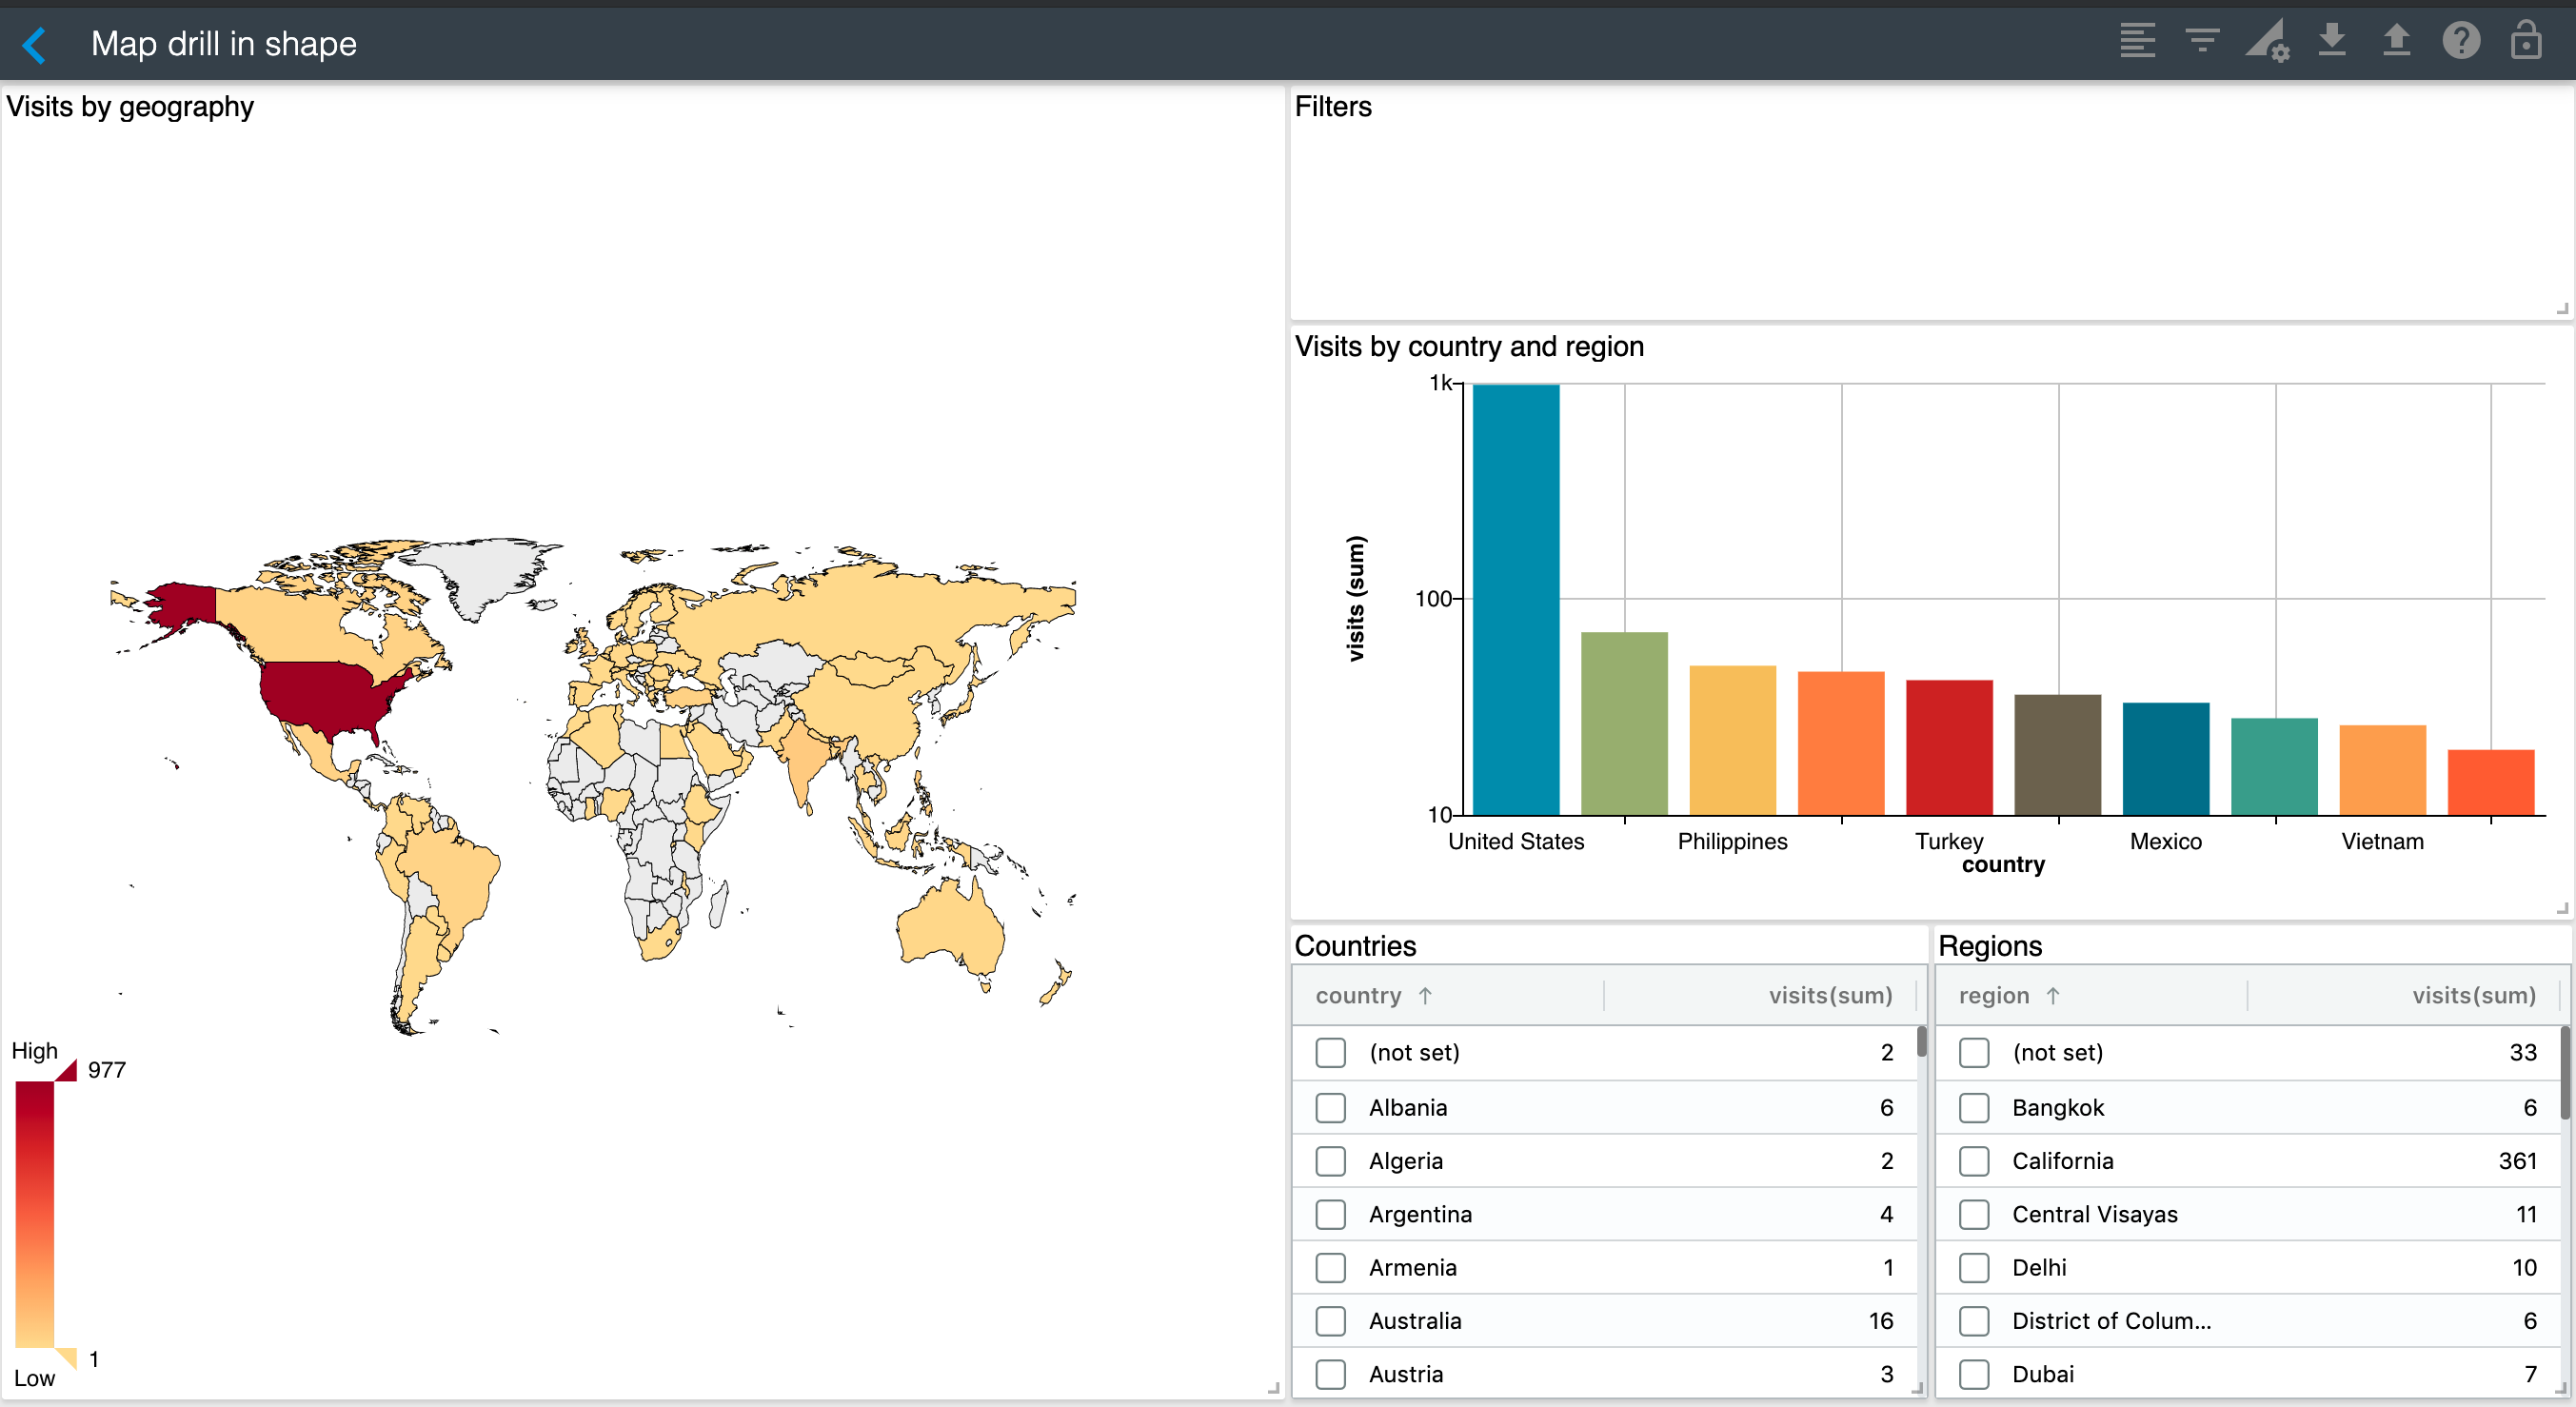
You can configure drill hierarchies for your visualizations using the interaction manager. Let's imagine you would like to configure a drill-in path for the bar chart in the dashboard below so that it goes from countries to regions when users click on one of the bars.
Steps:
- Open the Interaction Manager which is the component with the "Filters" title
- Edit its configuration as follows:
 1
 2
 3
 4
 5
 6
 7
 8
 9
10
11
12
13
14
15
let viz1 = getId("Visits by country and region") let drill = { [viz1]: { group1: ['geoNetwork.country', 'geoNetwork.region'] } }; // Define options let aktive = cf.create(); let myChart = aktive.graph("Interaction Manager") //.set("rules", rules) .set("drill", drill) .execute(); - Save the Interaction Manager
Now when you click on a bar representing a country, the chart will drill-in automatically to show the regions for the selected country.
Configuring drill hierarchies for shape-based visualizations
You may use shapes to represent geographical regions using vector maps or geo maps. In this case, drilling into an area means also changing the shape to visualize its sub-regions. For example, let's say you would like to configure a drill-in for the World vector map in the figure above so that it shows the United States shape with its different States when users select it.
Steps:
- Open the Interaction Manager which is the component with the "Filters" title
- Edit its configuration as follows:
1 2 3 4 5 6 7 8 9 10 11 12 13 14 15 16 17 18 19 20 21 22 23 24 25 26 27 28 29 30 31 32 33 34 35 36 37 38 39 40 41 42 | |
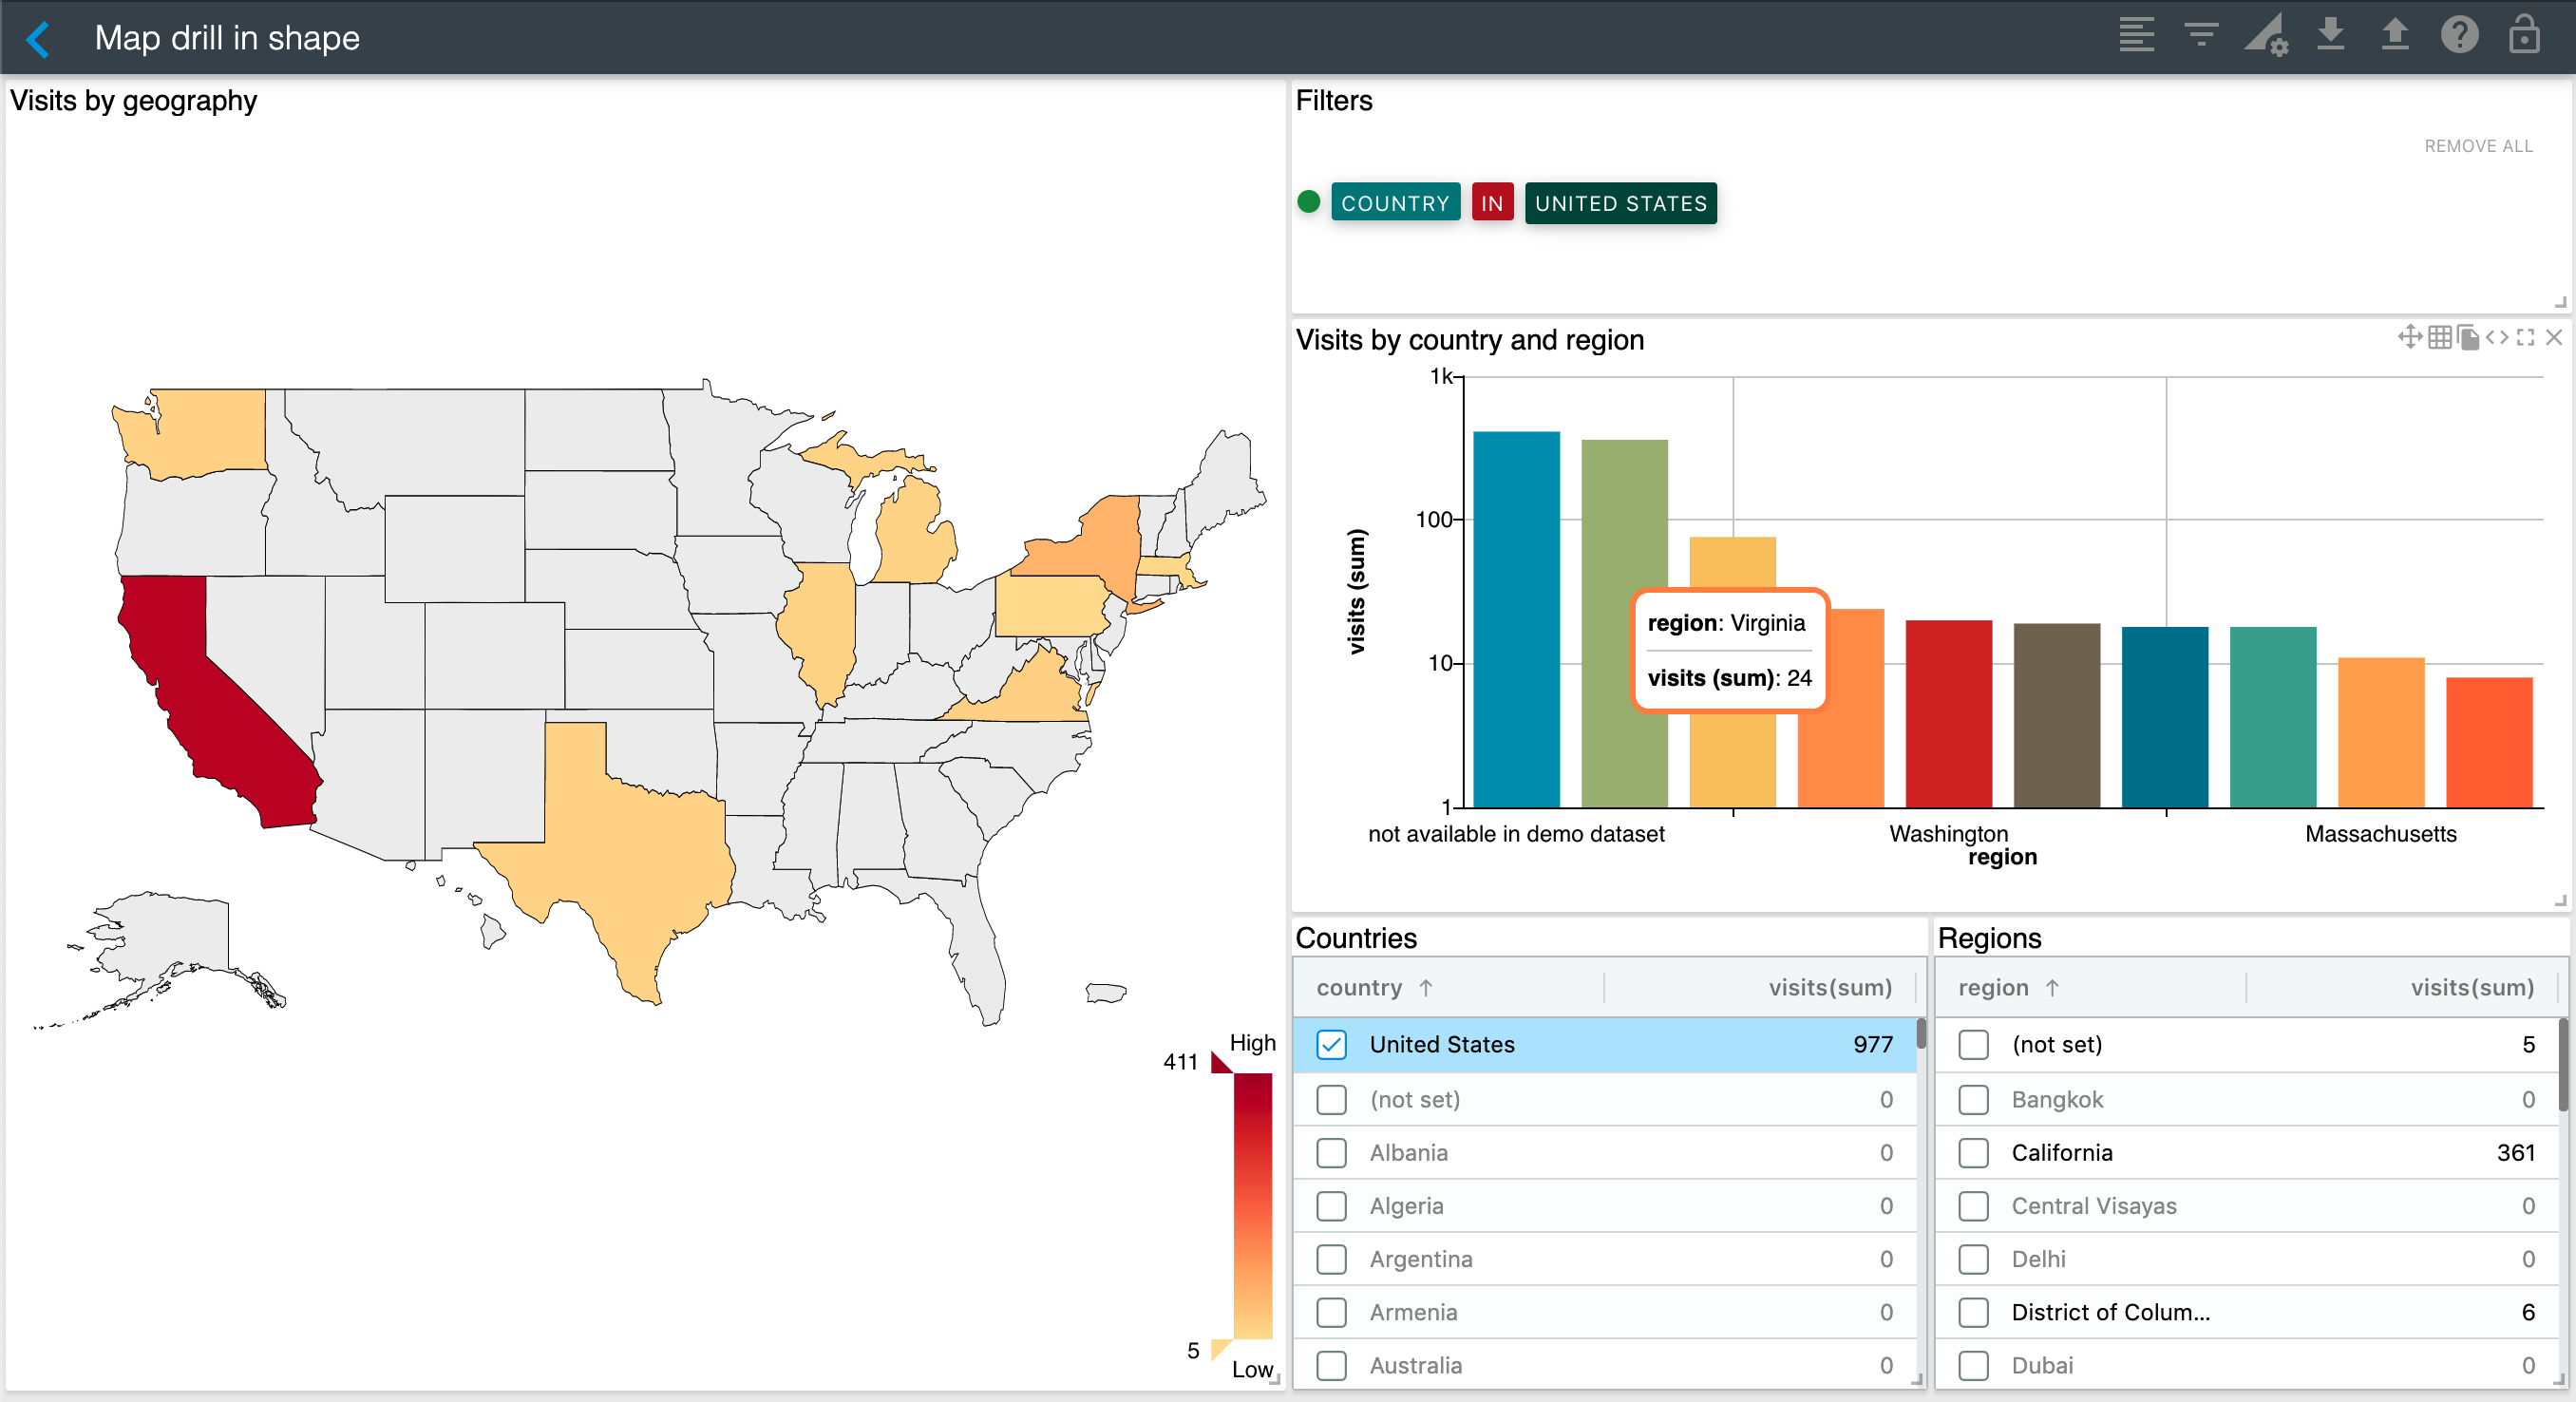
The result after selecting country United States is shown below:
You can specify the zoom level and center properties for each drill-in shape at any level. When using Geo Maps, the fitBounds property is also available to automatically adjust the map to the best center and maximum zoom level possible for the selected shape.
You can also specify the legend position for each drill-in shape. For example, notice how the map legend at the "world" level is on the left and it moves to the right when drilling into United States.
And you can refer to your custom shape files using a standard URL as shown for Australia. "world" and "usa" shapes are provided out-of-the-box.
Note
ChartFactor Studio ONLY supports updating the following visualization properties on drill-in, in addition to the field path: source, shape, zoom, center, legend, fitBounds and featureProperty (the last two are only available for Geo Map).
Please refer to the interaction manager's drill hierarchy section for full details on drill hierarchy configurations.