Bars
The bar chart presents categorical data with rectangular bars with heights or lenghts proportional to the values/metrics that they represent. The bars can be plotted vertically or horizontally.
A bar chart shows comparisons among discrete categories. One axis of the chart shows the specific categories being compared, and the other axis represents a measured value. Some bar charts present bar clustered or stacked in groups of more than one, showing the values of more than one measured variable.
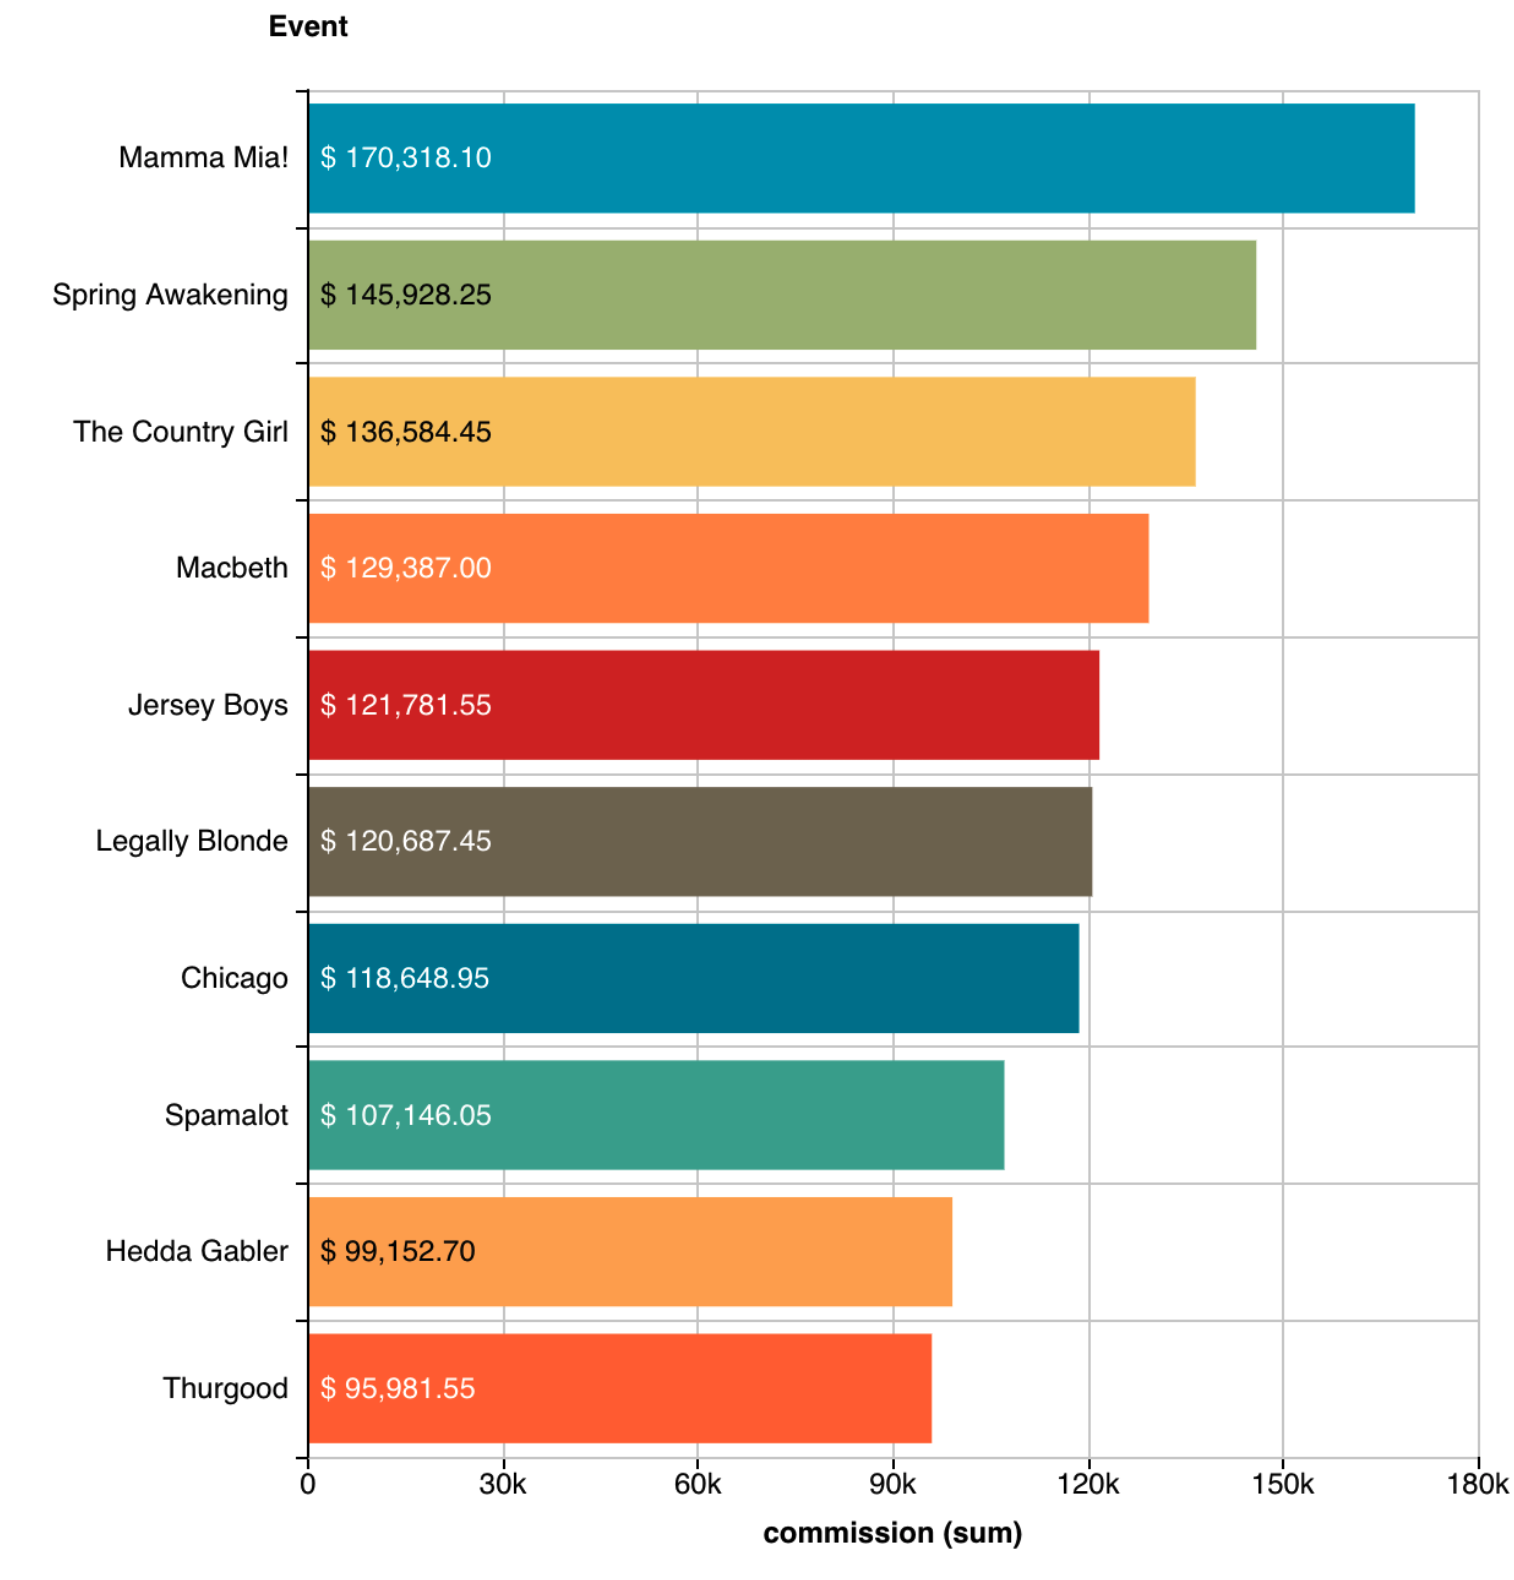
The Bars visualization requires at least one metric and one field.
1 2 3 4 5 6 7 8 9 10 11 12 13 14 15 16 17 18 19 20 21 | |
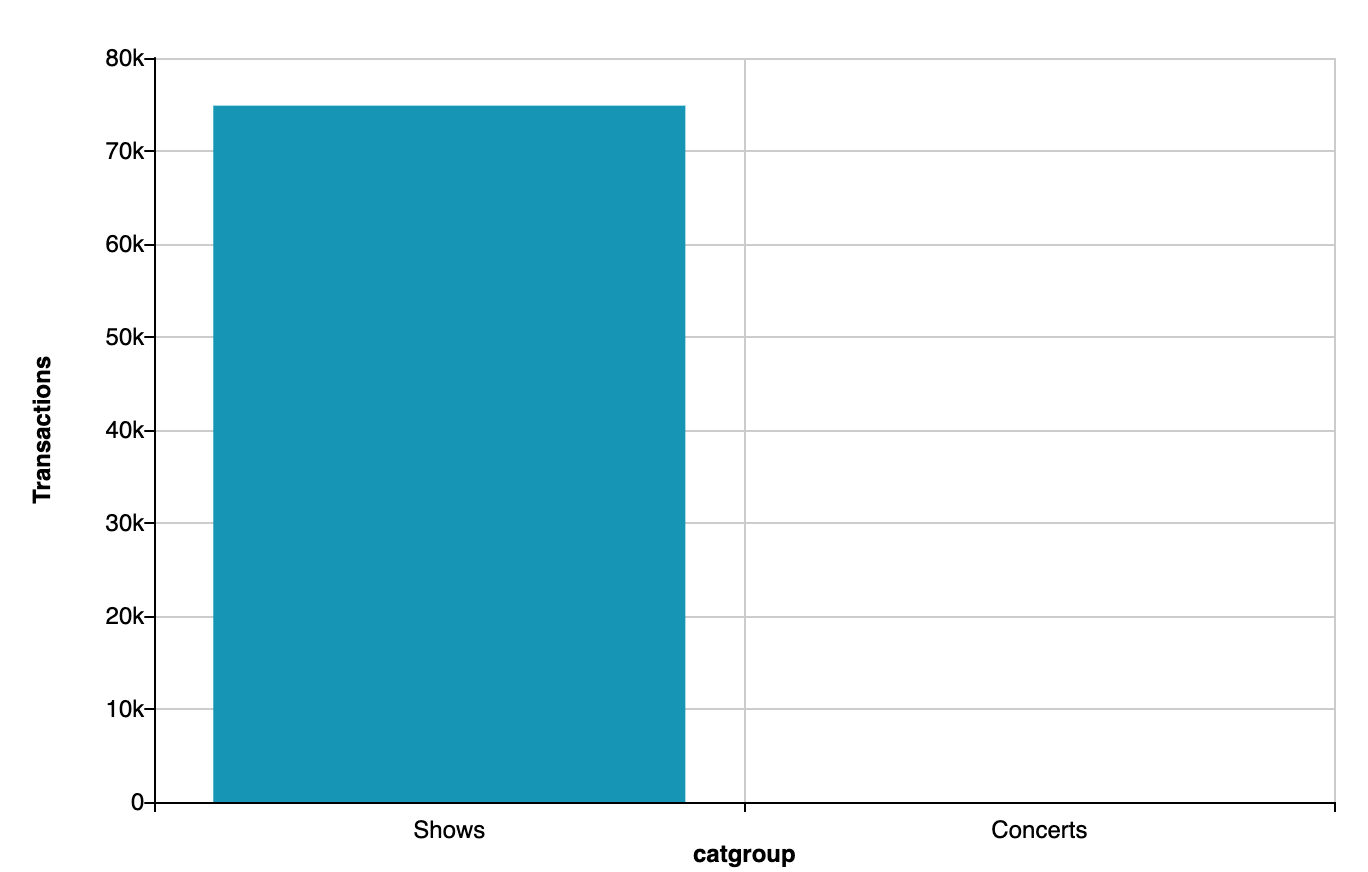
The previous code will render the Bars Chart below:
Mulimetric Bars
As the name indicates, this variation will create groups of metrics which can be clustered or stacked (default):
1 2 3 4 5 6 7 8 9 10 11 12 13 14 | |
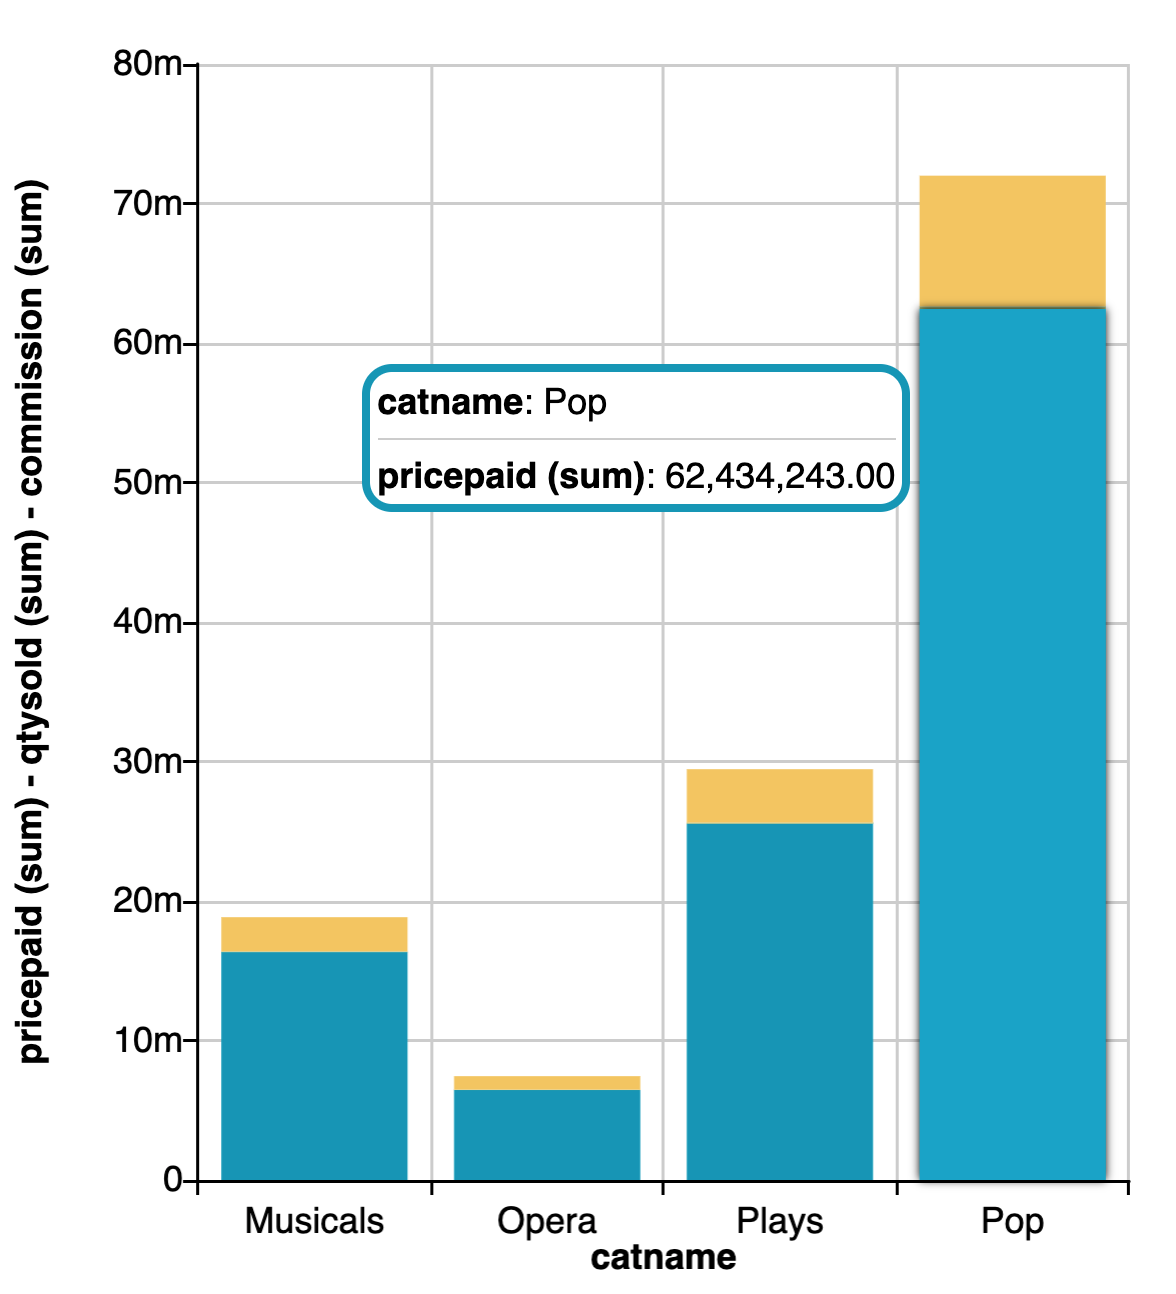
Note that in the above visualization, two metrics where included: "pricepaid" (blue) and "commission" (yellow), where the first one (the blue section) is being hovered. The more metrics we add, the more sections (or bars if the placement is clustered) will be created.
Only tooltip metrics
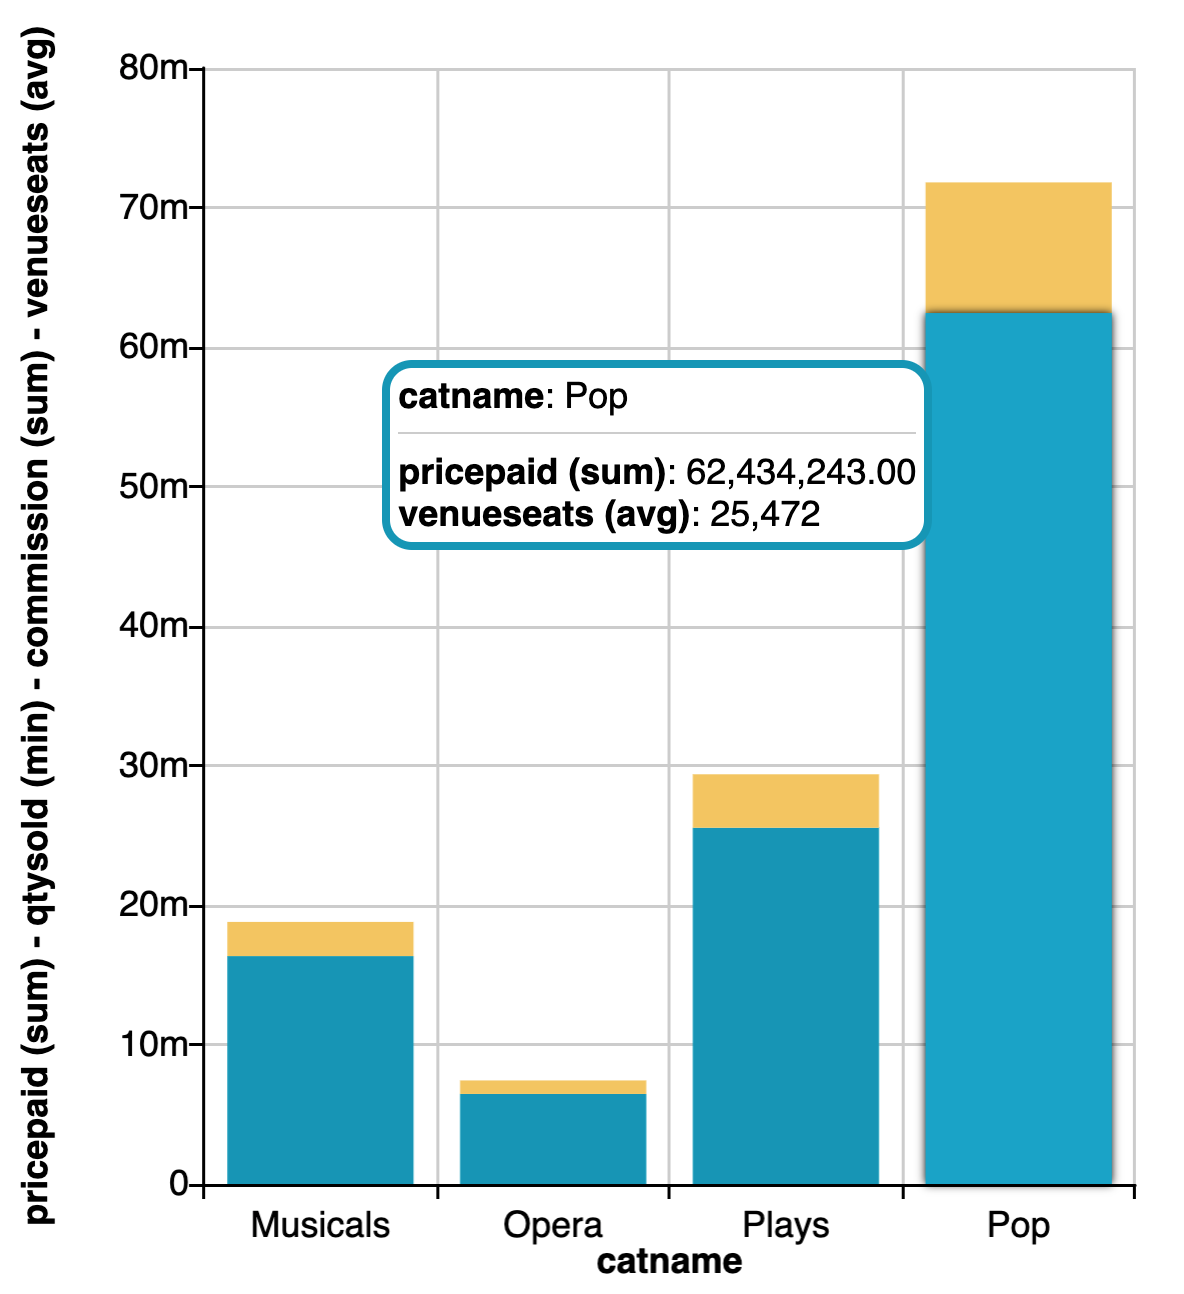
We may want to bring other metrics to display their values in the tooltips but not to create additional bar sections for them. In that case, these metrics must be marked with the onlyTooltip function like this:
1 2 3 4 5 | |
Notice now that the third metric "venueseats" is only visible from the tooltip but no bar section was created for it.
Static Values
The static values configuration allows to maintain attribute values in a Bar visualization even when they are filtered out. This behaviour is similar to client filters with the main difference that client filters are only applicable when the filter attribute matches the group-by attribute used in the visualization while the static values setting works with any filter.
1 2 3 4 5 6 7 8 9 10 11 12 13 14 15 | |
The above configuration renders the following bars:
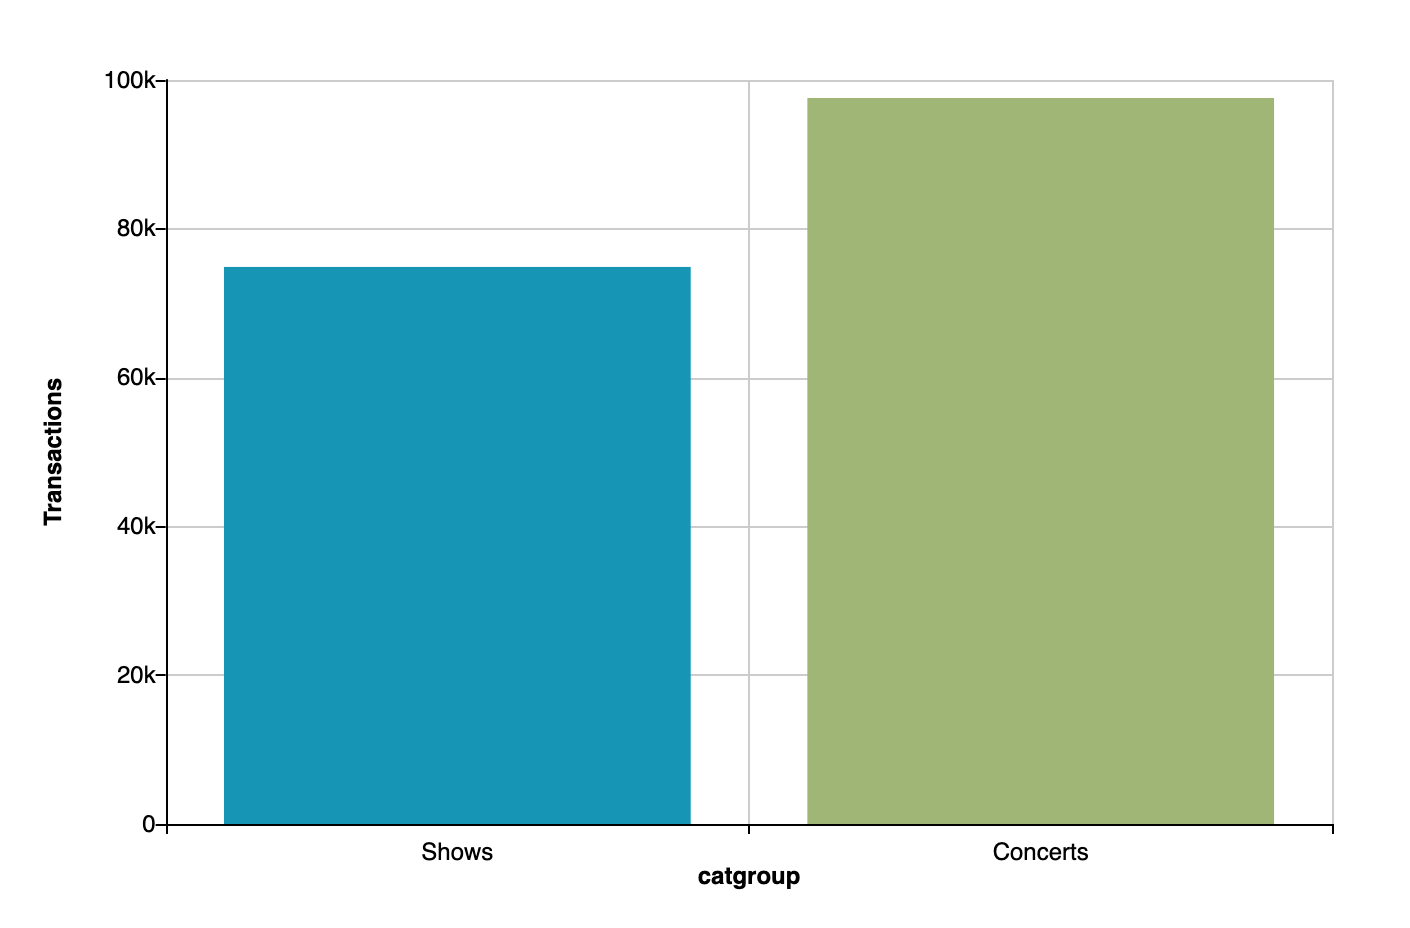
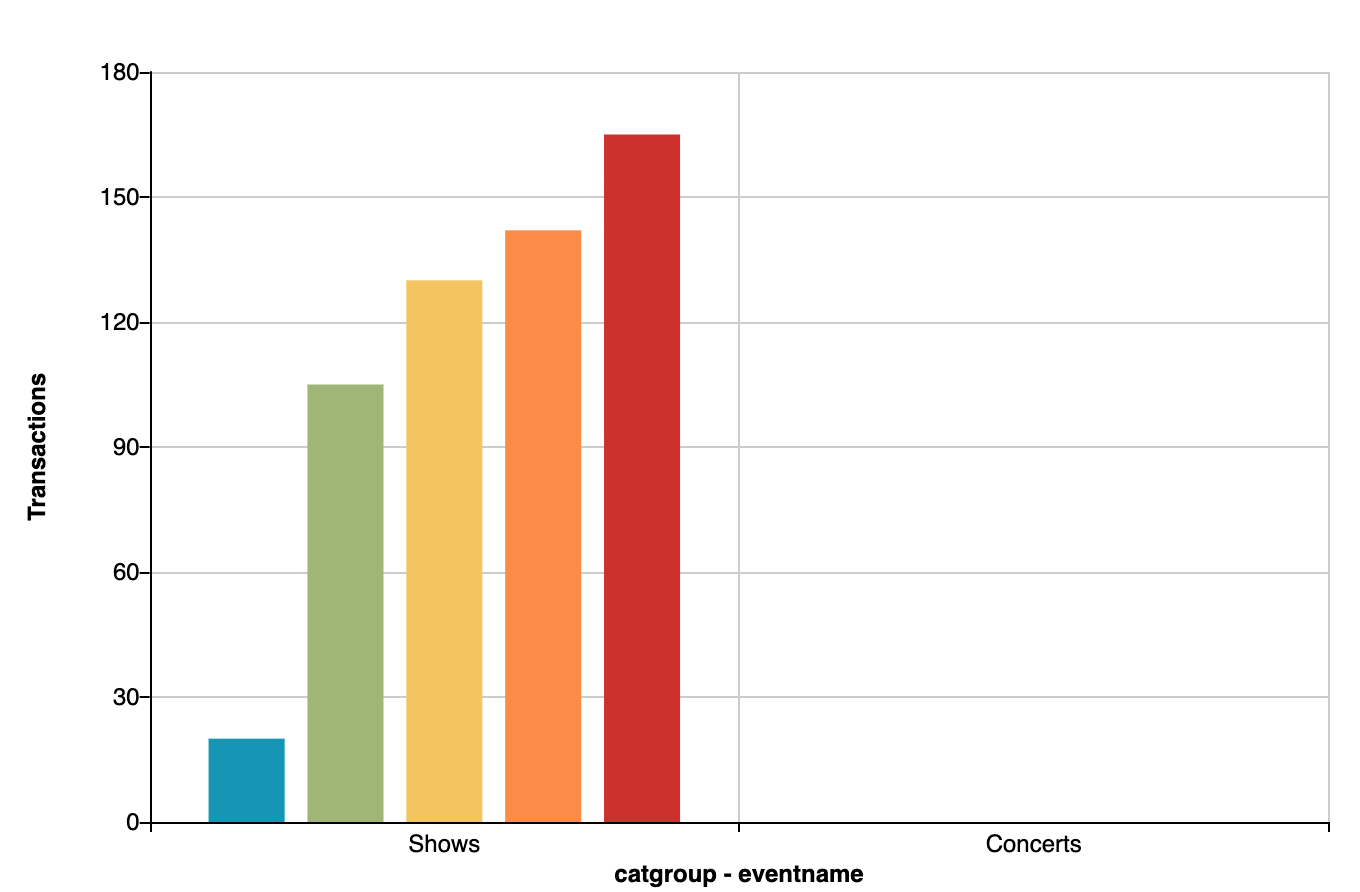
If "Concerts" is filtered out, it will still remain in the visualization as an empty value:
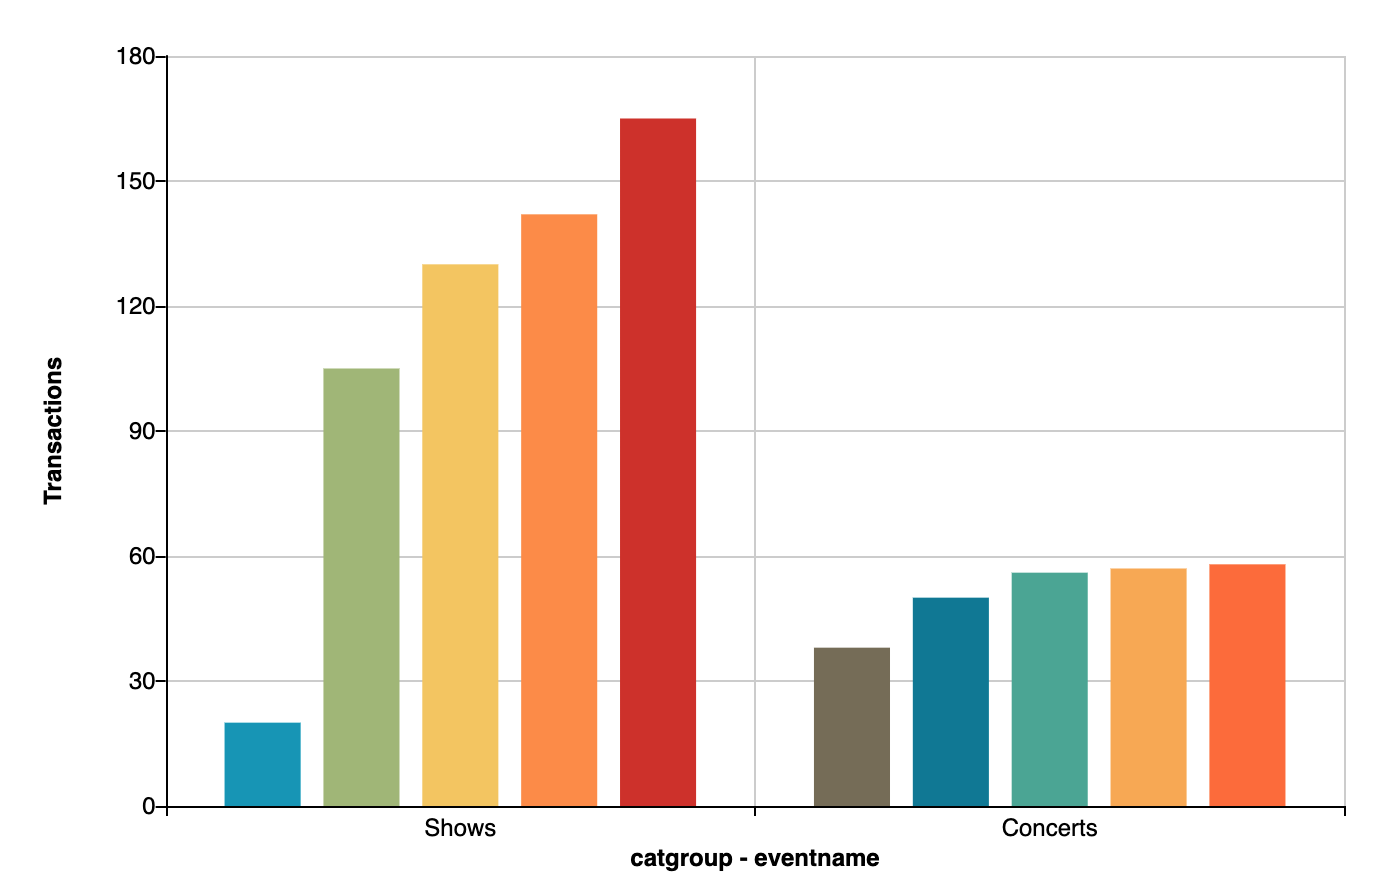
Same thing happens if we are using multigroup Bars:
Legend
Please refer to the legend documentation in the Visualizatin Options section for details on how to enable and configure legends.
Orientation
Please refer to the orientation documentation in the Visualizatin Options section for details on how to configure the bars orientation.
Bars placement
Please refer to the bars placement documentation in the Visualizatin Options section for details on how to configure the bars placement.
Bars width
Please refer to the bars width documentation in the Visualizatin Options section for details on how to configure the bars width.
Mark lines
Please refer to the mark lines documentation in the Visualizatin Options section for details on how to configure mark lines.
Metric marker
Please refer to the metric marker documentation in the Visualizatin Options section for details on how to configure metric markers.
Serie label
Please refer to the serie label documentation in the Visualizatin Options section for details on how to configure serie labels.